Seeing Echoes
Visualizing Text Reuse in Correspondence
Project Leader: Sinai Rusinek
Design Researchers: Tommaso Elli, Giovanni Moretti
Scholars: Ludovica Marinucci, Sinai Rusinek
About the project
Research of ‘Republics of Letters’ entails the study of various kinds of connections and relations between nodes of a network. The most commonly studied relationship in the analysis and visualization of correspondence is that between the correspondents, and network visualizations of correspondents are among the well known sights in our field.
Network analysis tools, however, can be applied to various kinds of data, which could be conceived as nodes and edges. The study of the texts themselves, where textual units are conceived as nodes, and various relations between them function as the edges of the network, can provide solutions and present important insights about any corpus, epistolary or not. Epistolary corpora, however, provide interesting challenges which were the gist of the team’s work in Como.
Unlike plagiarism, which normally refers to the use of more or less exact phrases or text sections, the humanist phenomenon of text re-use includes a broad range of methods, from citations and direct quotes to paraphrases and hidden references. It therefore also presents a bigger computational challenge. In recent years various text reuse algorithms and tools have been applied to various textual genres - from ancient literature to the Encyclopedie, to modern fiction and nonfiction and to newspaper collections, but not, to our knowledge, to correspondence collections. In a STSM this last winter, Sinai Rusinek explored the application of text reuse detection on the corpus using the Tracer tool, developed by Marco Büchler, with the intention to provide feedback that would help adapt the tool (which is still being developed and will be available as open source) to correspondence corpora, and to eventually enable, in addition to enriching the reading of the correspondence texts by hyperlinking to the quoted/referenced source, also to analyze and visualize the flow of ideas, tropes, motives, quotes and commonplaces in the corpus.
Keywords and collocations in corpora have been studied intensively for decades; yet, their study in correspondence corpora raises interesting challenges, which would be elaborated below in the next section. In her PhD research on the late writings of the Dutch scientist Christiaan Huygens, Ludovica Marinucci was using the text analysis package AntConc to find, list and compare the occurrences of the most important keywords (nouns and related adjectives) and their collocations and co-occurrences, related to the themes of potentia dei, divine and human intelligence, probabilistic epistemology, natural theology and the plurality of worlds in the correspondence of Huygens with contemporaries such as Lamothe le Voyer, Spinoza, Leibniz, Newton, Oldenburg and Hobbes, a correspondence which is part of the KNAW corpus.
The corpus was segmented to paragraphs, on the assumption that their comparison to each other, rather than of letters which are too long, or sentences which are too short, would yield the best results. This assumption will have to be checked in the future. If discovered otherwise, the following visualizations and analysis methodology will be no different. Together with the corpus, we had two additional data sets: A list of text reuse candidates (pairs of paragraphs) with a number of common features and a number that represents the degree of their similarity. These will be the edges in the clustered network. A subset of the nodes which included the various forms of the lexeme ‘Potentia’.
Aim of the project
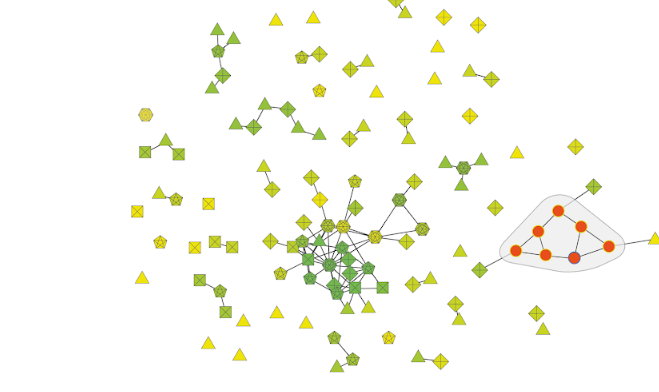
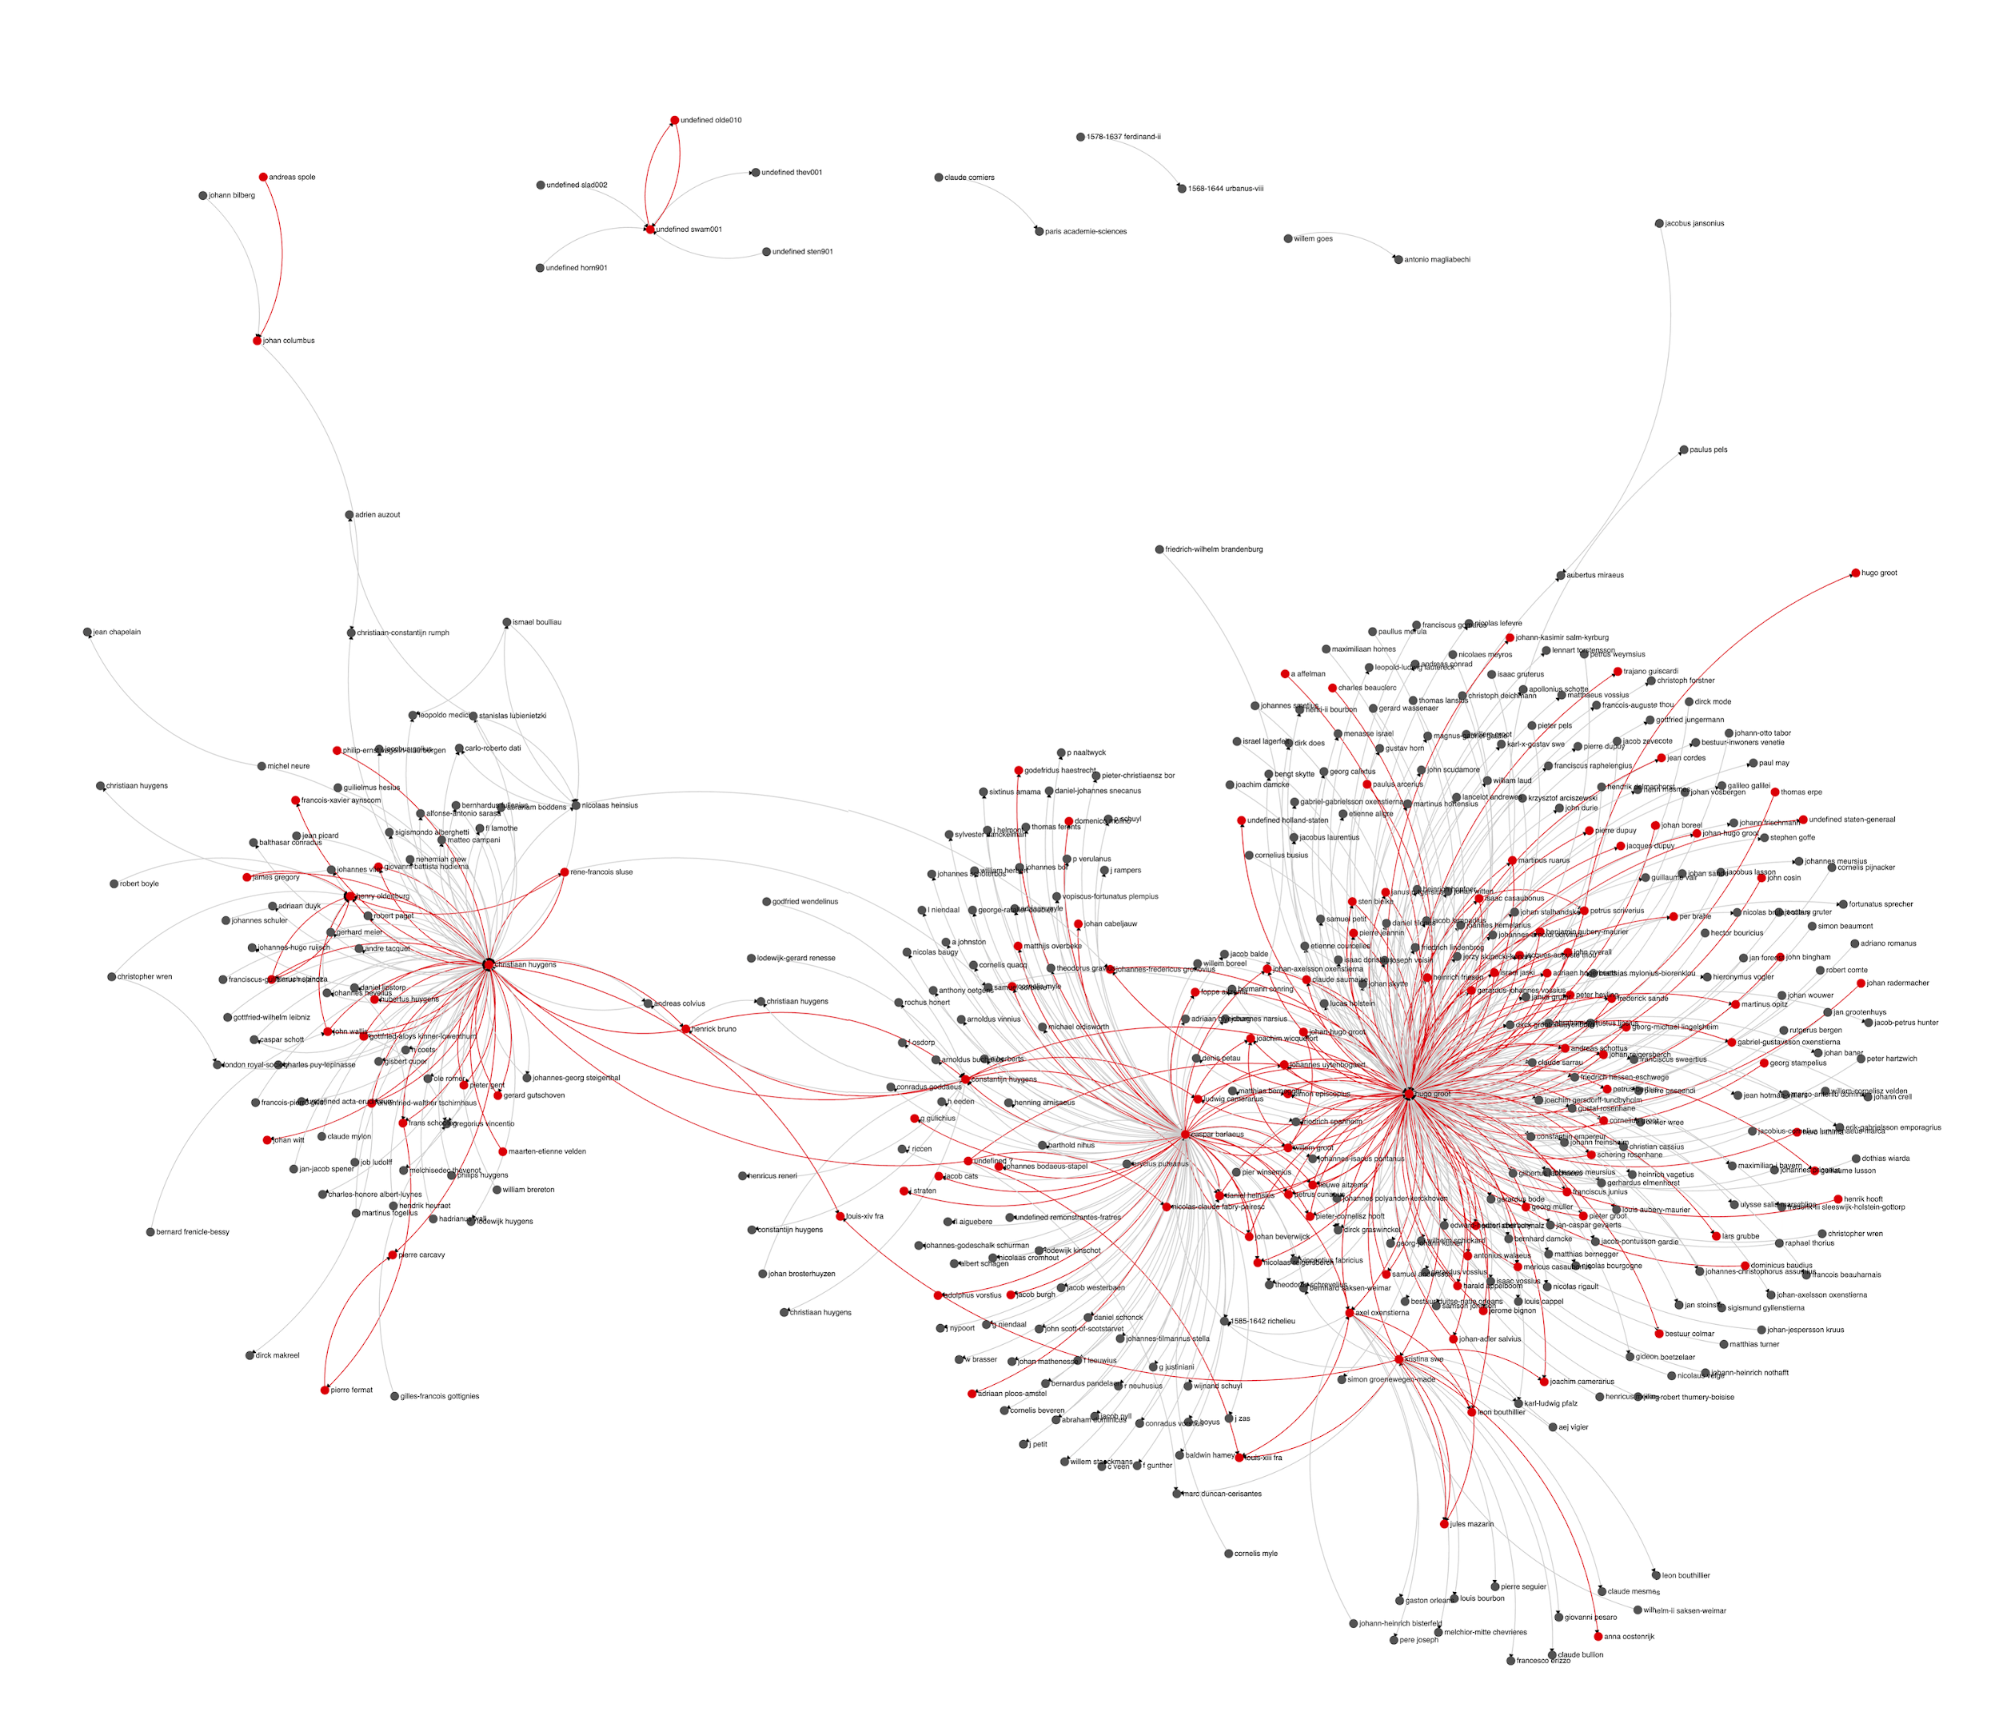
The findings of Sinai’s STSM raised a challenge: the results were simply too many, most of which are the ubiquitous formulae of opening and closing letters. For someone who is rather interested in quotes, aphorisms and similar kinds of text reuse, looking for relevant findings would be like finding a needle in a haystack. But even scholars interested in the biographical and social insights that a study of the “hay” itself (the formulae) can provide, have too many results to process. To solve this issue, Sinai used network analysis to organize the data and identify ‘clusters’: groups of similar text units that were found to be similar to each other. A Gephi visualization can not only map such clusters, but also color the nodes according to the author or recipient, in a way that would teach us about the use of formulae by certain individuals, or in addressing certain individuals. The two images below are snippet of the same part of the large network, where the nodes represent paragraphs (which appear in the labels), clustered according to their similarity, and colored by author (left) or recipient (right).
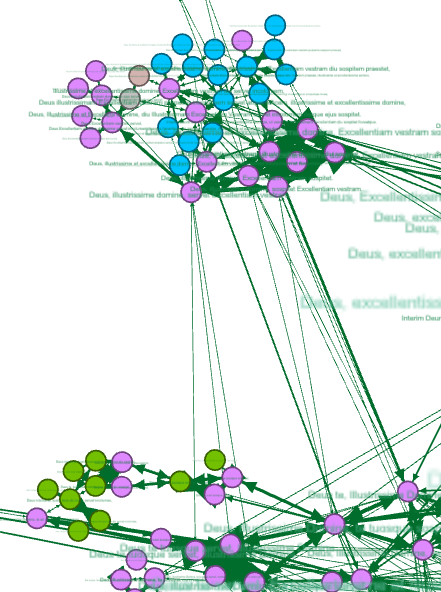 |
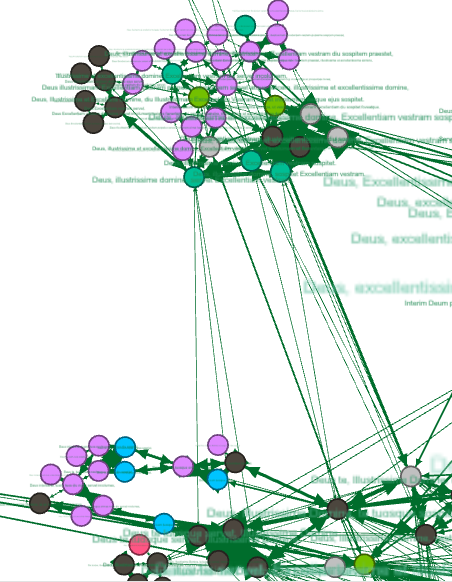 |
Here, however, the first problem arises: while the Gephi visualization may provide insights, it does not enable further analysis of each cluster. The first coding mission was therefore to isolate the clusters and prepare them for visualization of a different kind.
The second, and more significant problem we faced, is that while in a normal corpus, results of a search may be easily mapped on the parts of the corpus, for example, in a histogram or concordance plot, these two dimensional tools will not suffice to make sense of the data in the context of the complex, networked structure of a correspondence corpus. This seminal problem is common to various scenarios of studies in addition to that of text reuse detection results. How, for example, can one understand and evaluate the group of letters in a correspondence which discuss ‘’potentia”, use the term “potentia dei”, or both “potentia” and “ratio”? The second challenge was therefore taking a subset of the corpus which represents a certain textual phenomenon, and superimpose it on a correspondence network.
Case study
The corpus our team was working with is the corpus of CKCC (Circulation of Knowledge and Learned Practices in the 17th-century Dutch Republic), a corpus which consists of various correspondences of scholars who were active in the Netherlands in the 17th-century. It was downloaded from DANS in XML form and was converted to plain text files using python scripts. The phenomena studied in it were Text re-use, Collocations and Keywords.
Design process
In order to proceed to the visualization challenges, Giovanni Moretti, the team’s developer, converted the data to Json format (first figure below), and developed a java parser (second figure below) to compute clusters. The results was therefore nodes aggregated in clusters according to a given threshold of similarity. The clustering pattern would obviously change according to the threshold, and it would be interesting to explore, at a later stage, their interaction.
The clusterer
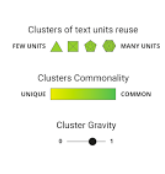
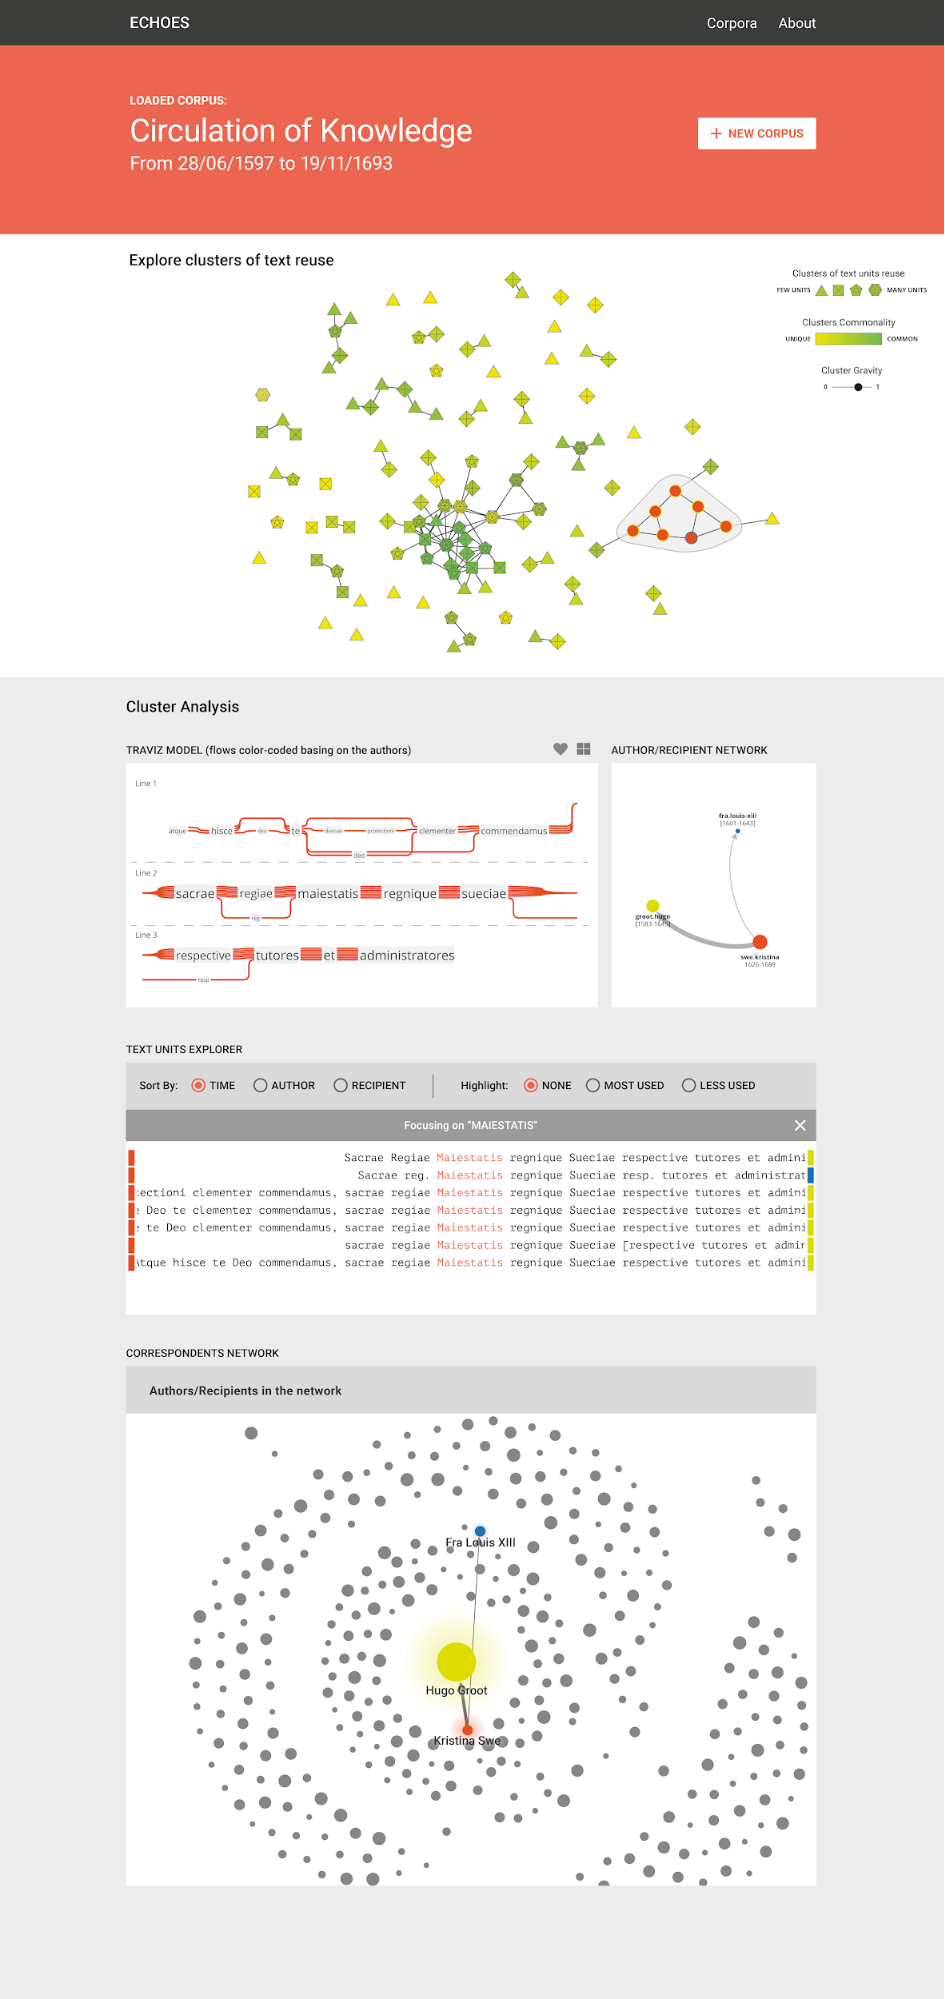
Parallel to Giovanni’s coding work, Tommaso Elli worked with Adobe Illustrator to create the design. What could perhaps count as “the most interesting obstacle” we encountered was that even after clustering, the results were too many to conveniently analyse. We therefore had to move up a level, and present meta-clusters - clusters of clusters, as in the illustration below. The further challenge was to then convey to the viewer that the nodes in the visualization are in fact clusters, and this was done by representing them as polygons. A legend (here on the left) would then explicate this representation. In addition, the meta-clusters will be coloured according to their commonality (technically, their centrality in the meta-network of clusters).
For example, a cluster such as “Vale…cum uxore”, has many variants (such as, ”Vale, frater optimus, cum uxore” or “salve, frater cum uxore et liberis”, and is therefore likely to be represented as hexagone. It is also related to several similar clusters, e.g. “Vale… vir illustrissimus” or “Deus te, frater optimus… sospitet”, and it is therefore coloured green, for its commonality. The viewer can also set the threshold of similarity (represented as “cluster gravity”, since the threshold determines clustering).
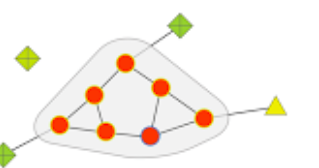
Clicking each cluster in the network will open and reveal its inner structure. The inner circle of the nodes will be coloured by the author. In the detail on the left we see that all text units (nodes) were written by the same author. The circle stroke will be coloured by the recipients. Here, one of the text units was sent to a different recipients (and therefore surrounded with blue) than others.
As a cluster reveals its inner structure, its analysis will also appear below. Here, an external tool, the TraViz, created by Stefan Jaenicke from Leipzig University, was used to visualize a collation of the text units in the cluster. The TraViz visualization is interactive and can be explored by highlighting a selected unit. In addition to the collation, a network view of the cluster will show who used the text units, addressing whom. The correlation between the two illustrations, as well as with the nodes in the cluster network above, will be conveyed by the correlation of the colors, and clicking each nodes in the author/recipient network (below right) will highlight the respective lines in the collation (below left).
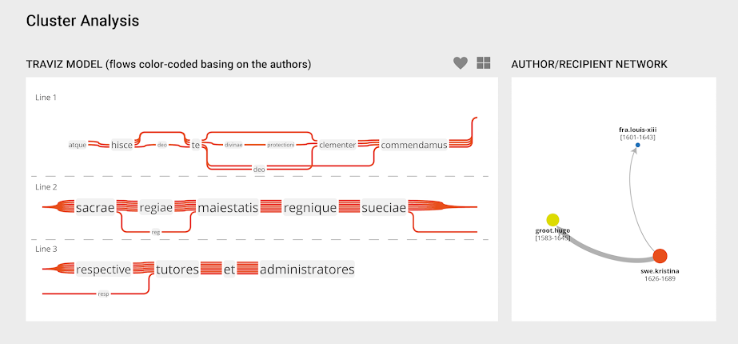
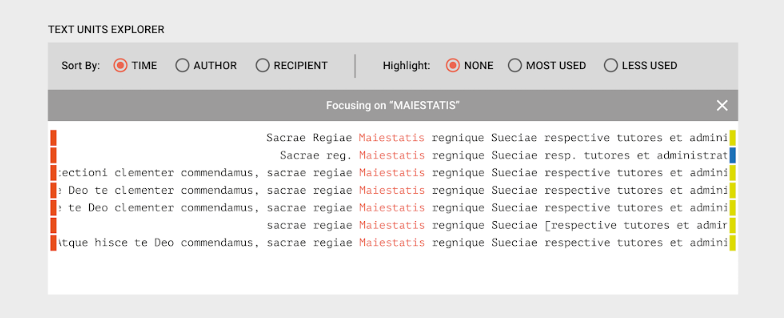
Below the collation, a different view will be provided to enable additional analysis of the cluster of texts. The scholar could chose to sort the text units according to time, author or recipient, and highlight the version less, or most used, and also center on a chosen word in the cluster. The colours in the margins will represent the author and recipient of each text unit, again in accordance with the colours in the other visualizations of the same cluster.
Having detected, surveyed and analysed the text reuse clusters, what is needed further is to contextualize them by locating them in the larger socially networked whole, that is the correspondence corpus. The contextualization box illustrated below ( differently than the prototype, in that it does not show the edges) will appear under the author/recipient visualization box on the right. The background correspondence network is similar to the networked visualization provided in the Epistolarium, but the cluster studied will be highlighted.
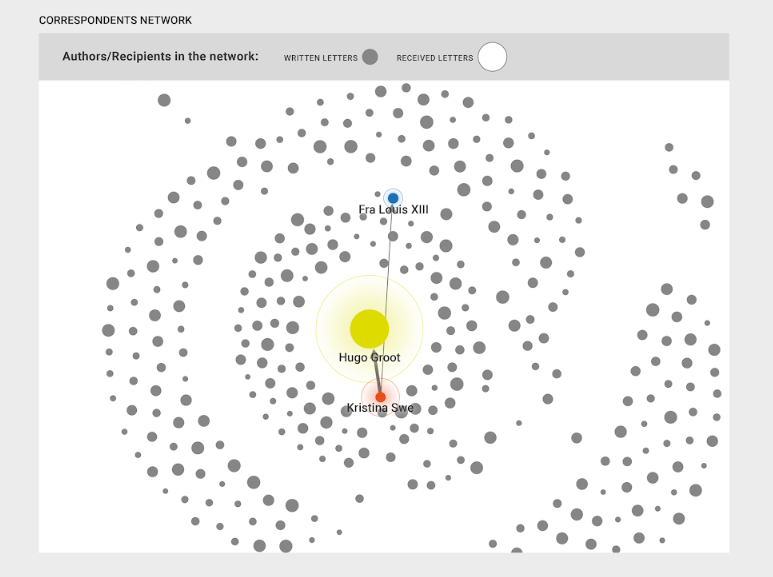
The same can be done with each textual phenomenon in the letters. Here below the correspondences which include one of the forms of the concept Potentia (captured by the regular expression) are highlighted against the background of the correspondence corpus. The same can be done with topics, collocation and co-occurrence pairs.
Project Diagram
Conclusions
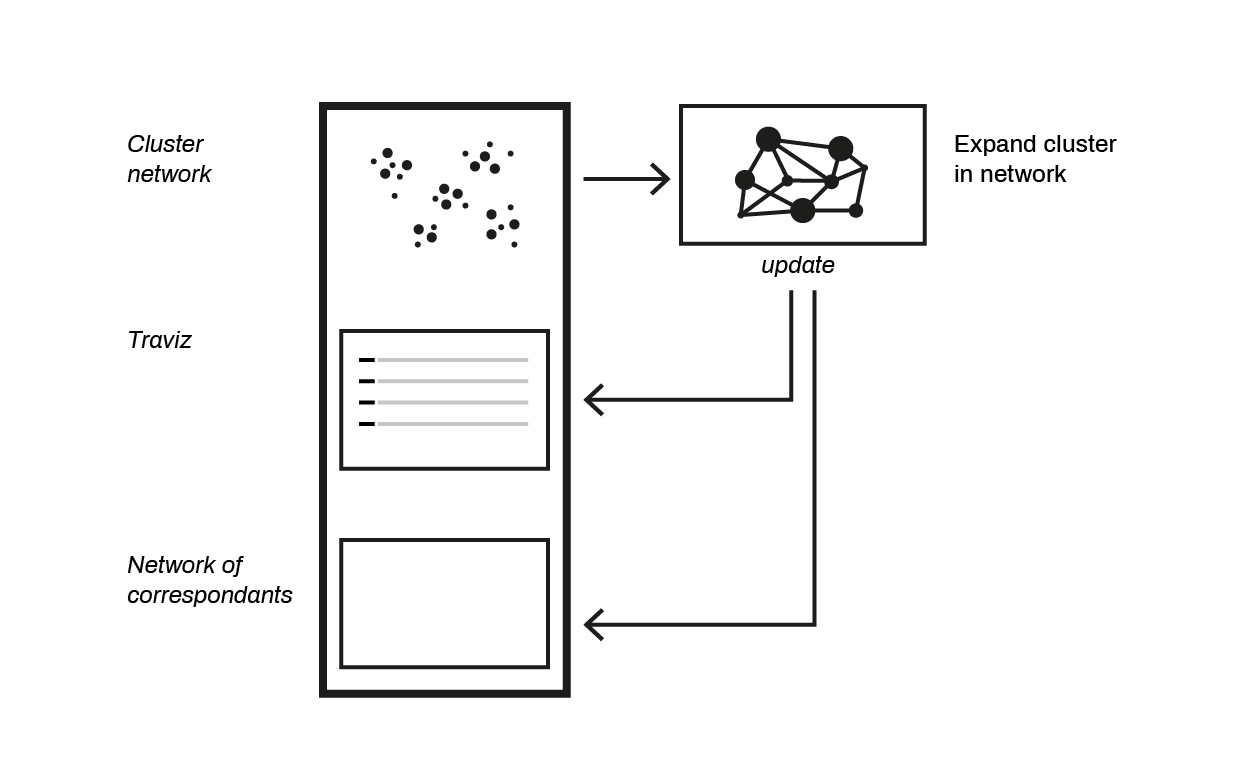
The image shows the workflow and the order of boxes in the prototype created in Como. As soon as a cluster-node is clicked in the cluster network, the analysis and contextualization windows will appear below it (before it is clicked, the place could be used for an explanation). Not all features have been implemented in the prototype.
One important main feature that, for lack of time, was not implemented in the demo is a scroll bar under the correspondence network that would make it possible to select the letters (represented as edges) written in a certain period of time, while rendering opaque the rest of the edges.
Three additional features were mentioned:
- A contextualization of each text reuse in its co-text, meaning, highlighting the unit on a full view of the letter, with its metadata.
- Parallel view for comparison of two or three letters, where the text reuse compared is highlighted.
- And finally, a visualization of the phenomenon studied mapped onto a visualization of the corpus NOT as network, but rather as a faceted grid.
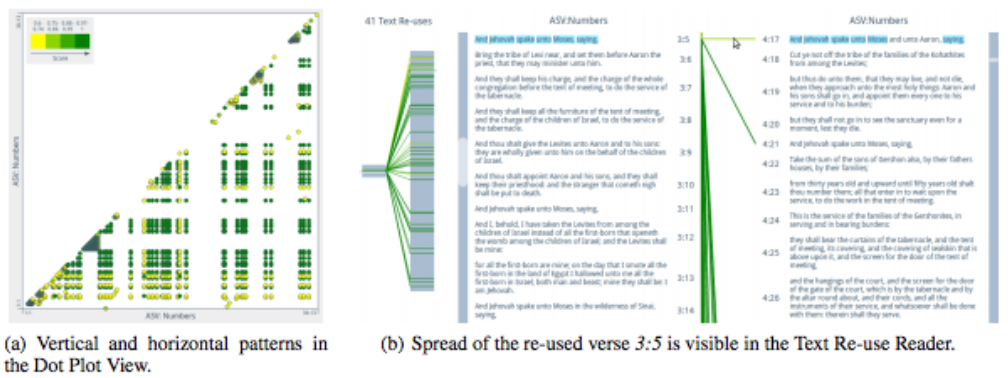
These three views are implemented already by Stefan Jaenicke in his Text Reuse reader, the dot plot and grid view, as well as the gridview below. These could be adopted to the workflow of our project. The latter, however, should be further developed to provide more flexibility, and enable the scholar to manipulate the grid according to the various facets available in the metadata.
If, as we explained before, the first challenge of our work was to enable an analysis of a certain pattern (text reuse) in a text by clustering and processing of each cluster, and the second challenge was taking a subset of the corpus which represents a certain textual phenomenon (text reuse or uses of keywords), and superimpose it on a visualization of the corpus, then it is obvious that the tools described here will be useful for many other research scenarios. The integration of alignment and grid views into our workflow will make it usable for the study of any textual phenomena which appears in large numbers in a corpus.
Finally, to go back to correspondence study: as in many aspects of epistolary texts, it would be wrong to forget that the letters existed in a broader intellectual context, alongside books. Including in this visualization a representation of a non epistolary corpus and its relations to the letters will be an additional visualization challenge, but worth the effort. Imagine, for example, a ring surrounding the entire cluster network, where sections of the ring represent the old and new testament, Ancient Greek and Roman literatures, the writings of Erasmus and the opera of Grotius, Huygens and Barlaeus, the main authors in the correspondence corpus. Edges representing similarity will stretch from the nodes inside to the section outside. This final feature will enhance our understanding of the letters not as an artificially isolated world in itself, but in their historical intellectual reality.
To conclude, we are eager to bring the prototype forward and continue in its development, and hope to find resources that will help us in doing so. We will attempt to present it not only in the Cost event at Warsaw but in additional DH venues, events as well as publications.