A representative vision
of nutrion's (in)securities
nutrition
Nutrition is the intake of food, considered in relation to the body’s dietary needs. Good nutrition – an adequate, well balanced diet combined with regular physical activity – is a cornerstone of good health. Poor nutrition can lead to reduced immunity, increased susceptibility to disease, impaired physical and mental development, and reduced productivity.
who
food security
Exists when all people, at all times, have physical and economic access to sufficient, safe and nutritious food to meet their dietary needs and food preferences for an active and healthy life.
World Food Summit, 1996
Intrinsic to this definition are the four pillars of food security, that is, availability, stability of supply, access and utilization by the body. While not always explicit, each pillar contains nutrition considerations and components crucial to the links in the chain between national food economies, households and individual well-being.
Food and Nutrition Security Strategy Note - FAO
"All people, at all times"
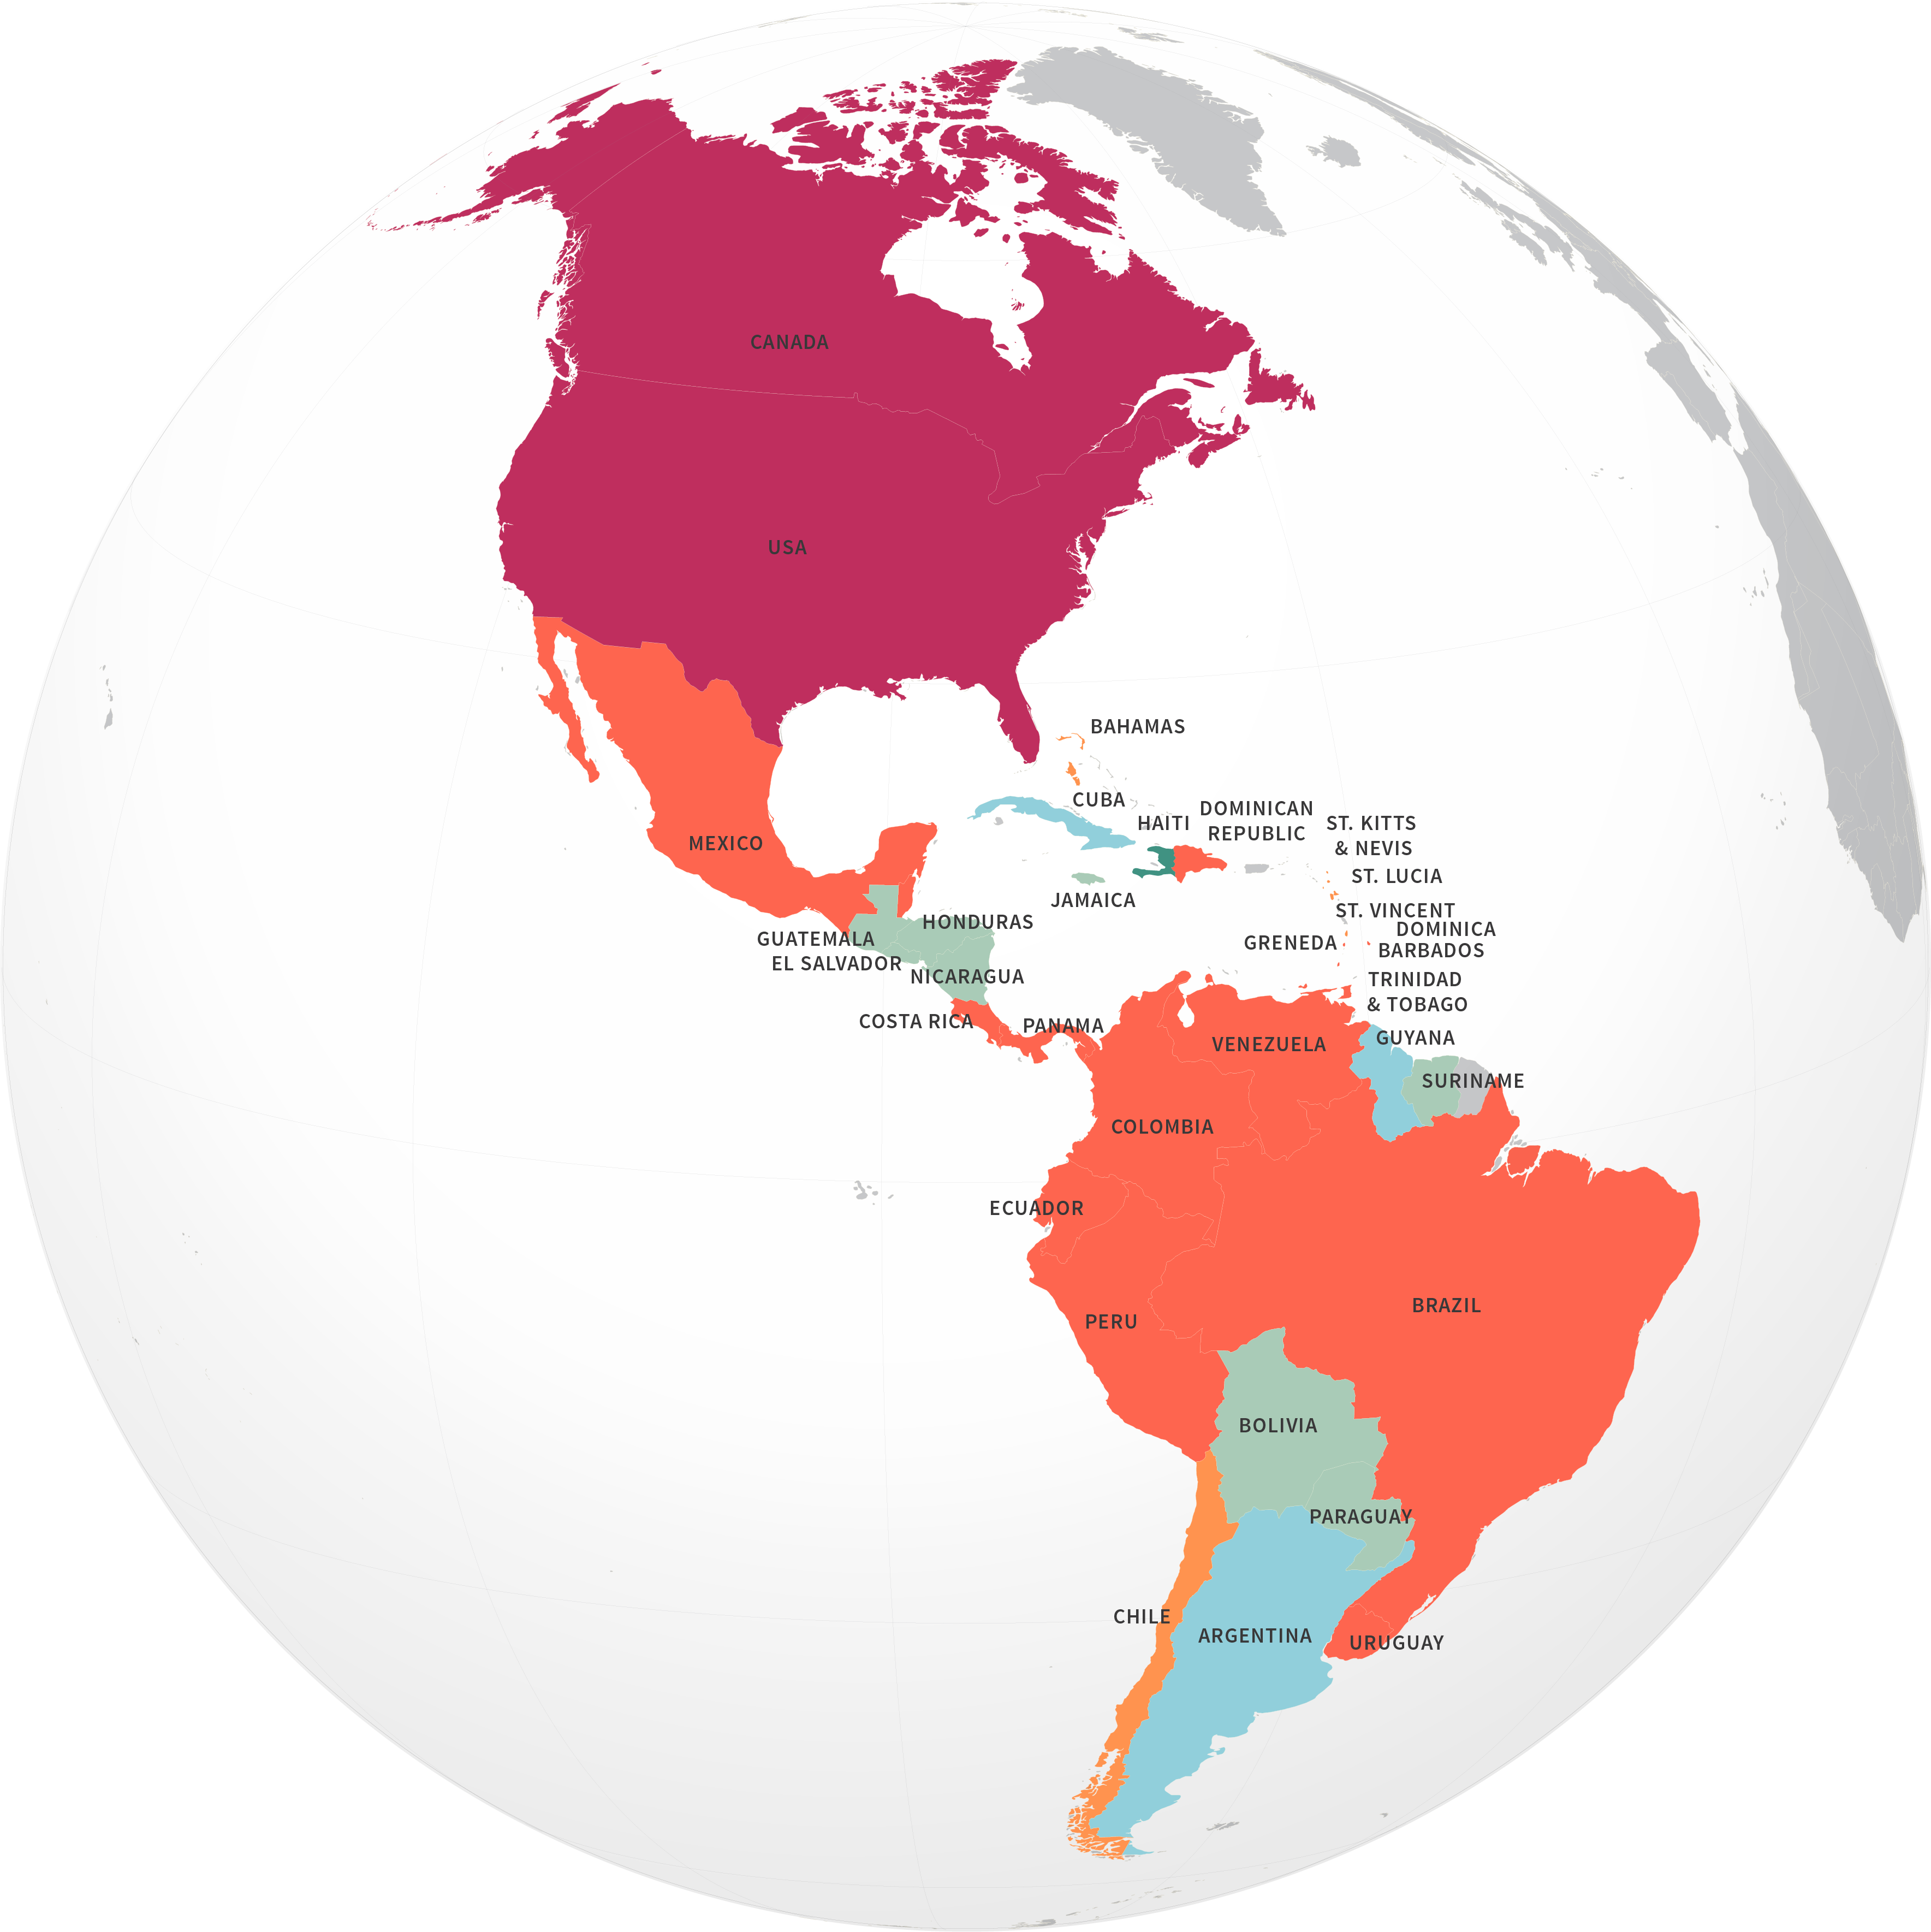
In order to provide a first global view of the situation, we focus on a values’ combination of production, supply, import and export, referred to each geographic area of the world. The cluster analysis shows how different is the involvement of the areas in the economical overview, with the highest and complete participation for Northern America and Western Europe. In general, every continent has features that make it suitable for more than a group of the cluster, except for Africa, whom geographic areas are all held in the lowest category.
We decide to investigate the topic in a delineated period of time. From 1961 to 2011 we notice that supplies grow progressively, reaching the top in the triennium 2009-2011, that is also the last one in which FAO provide us exact data.


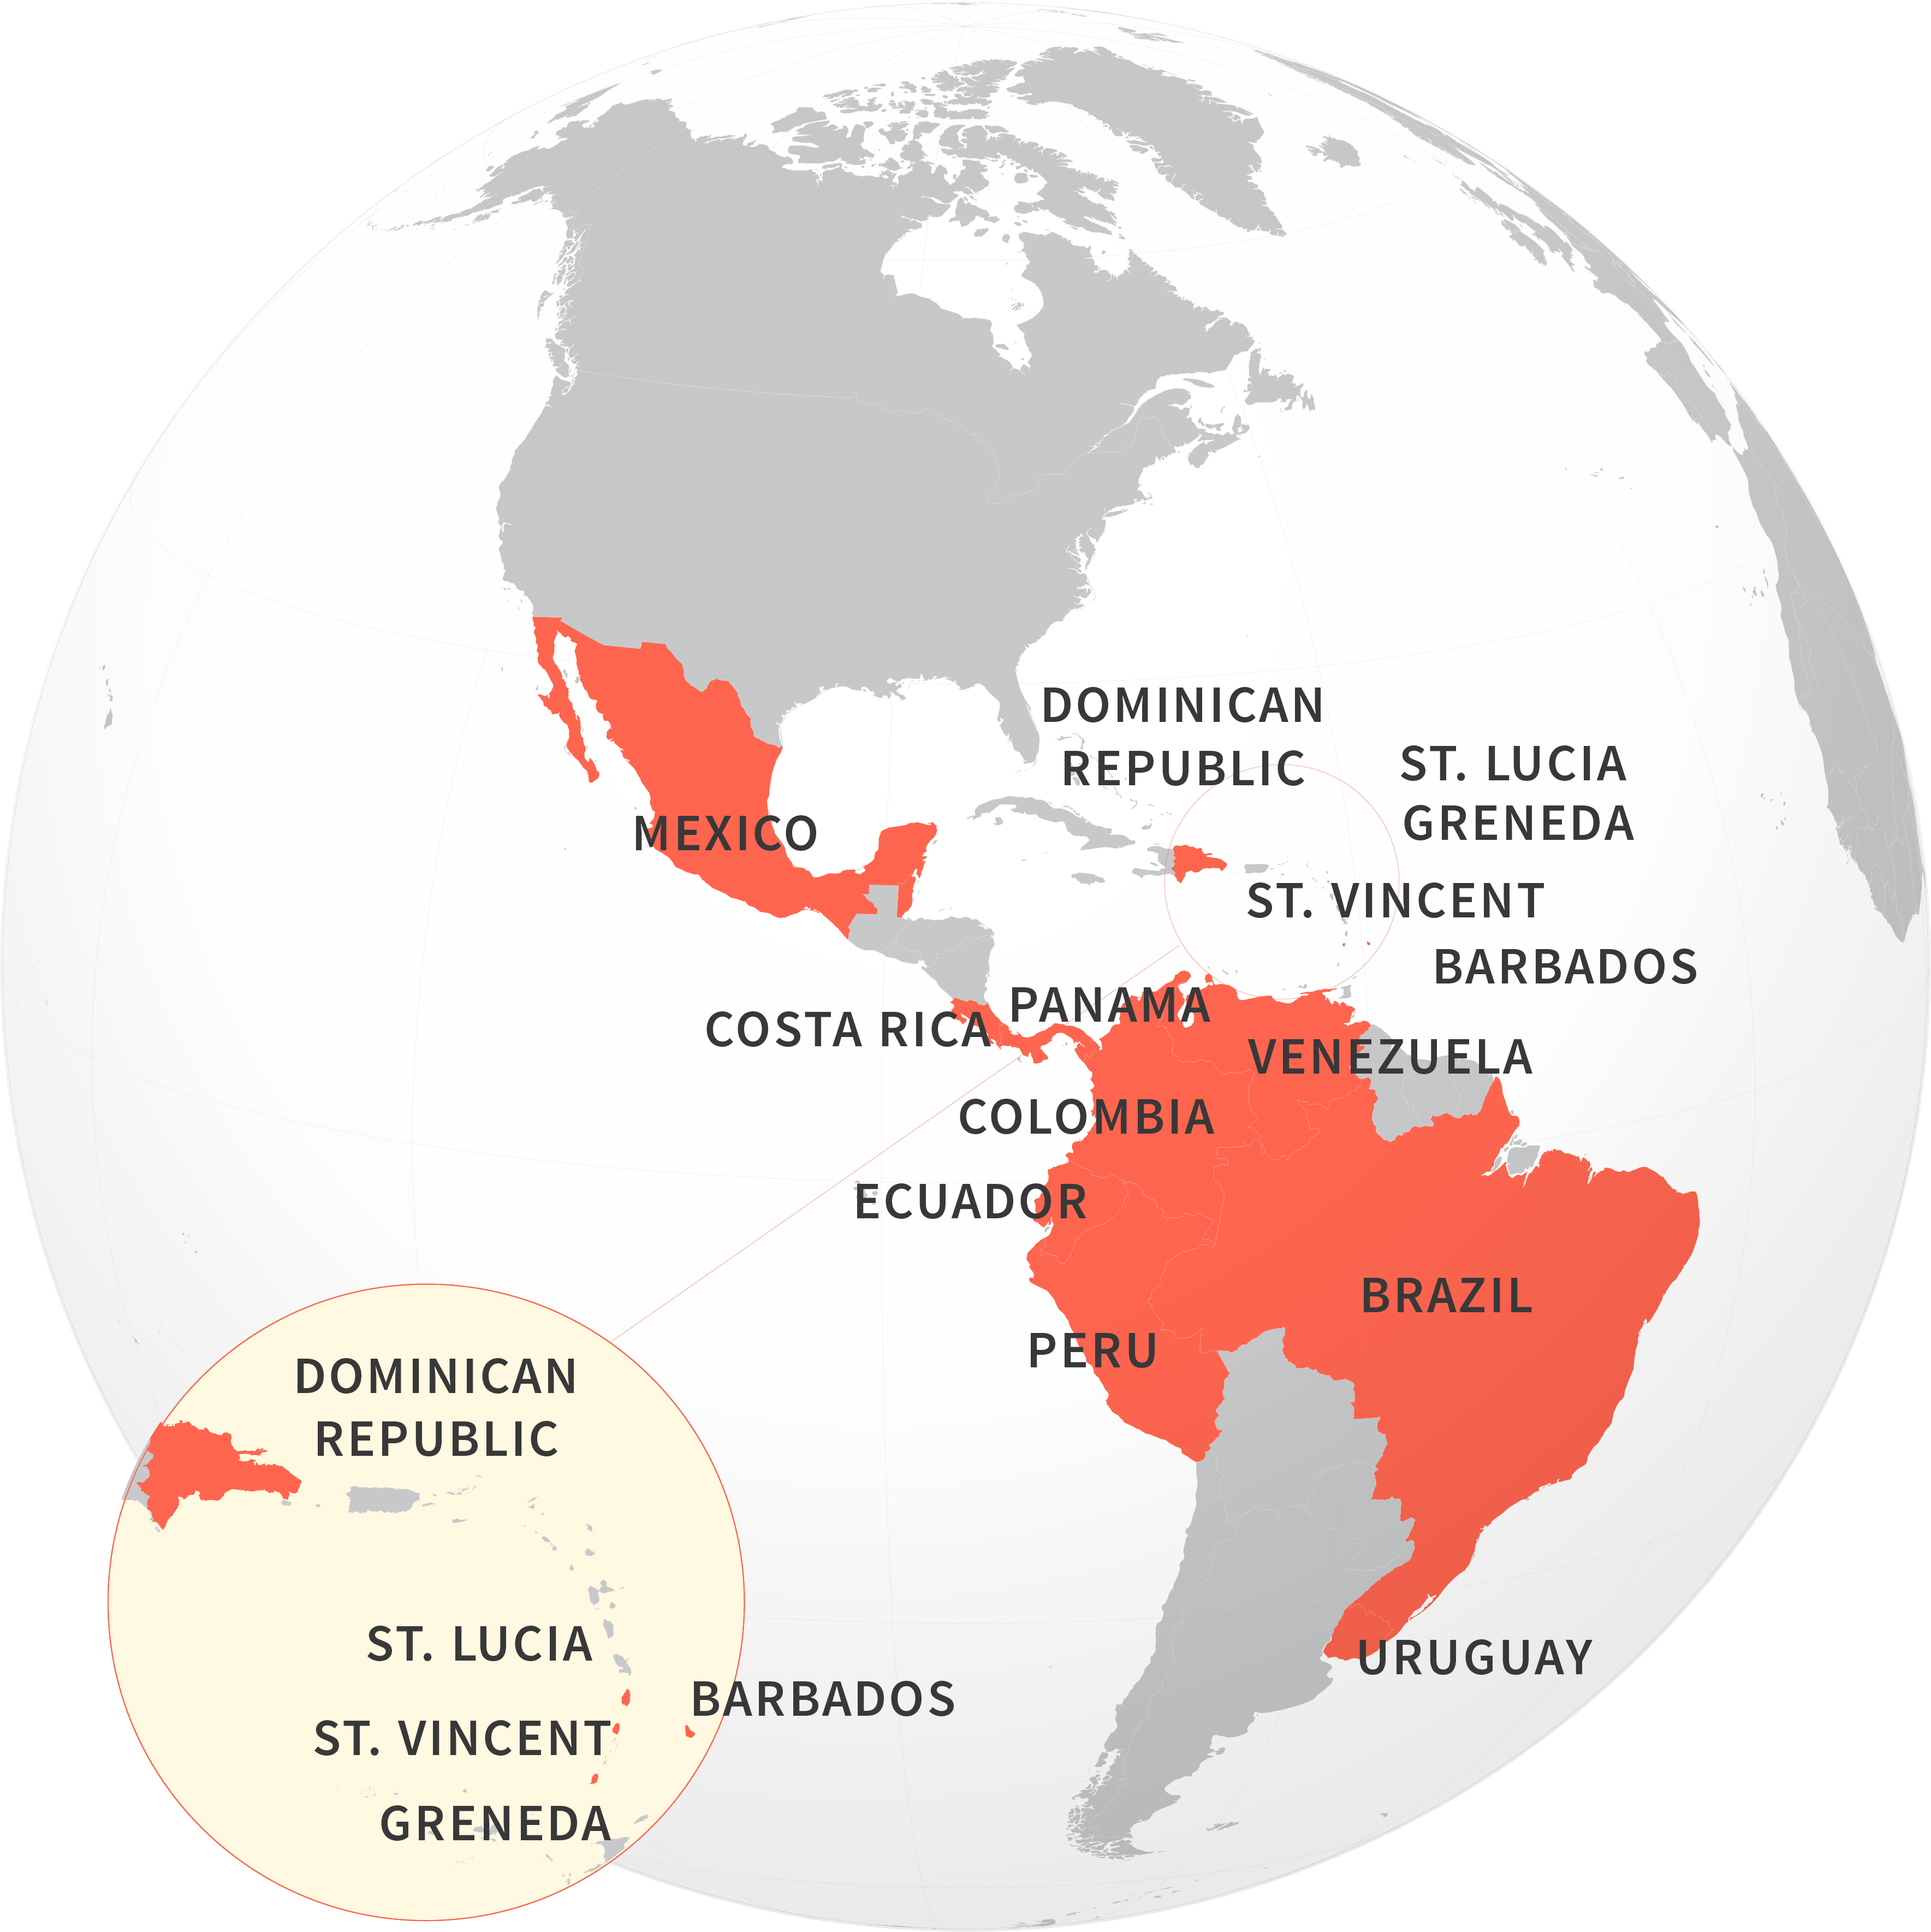
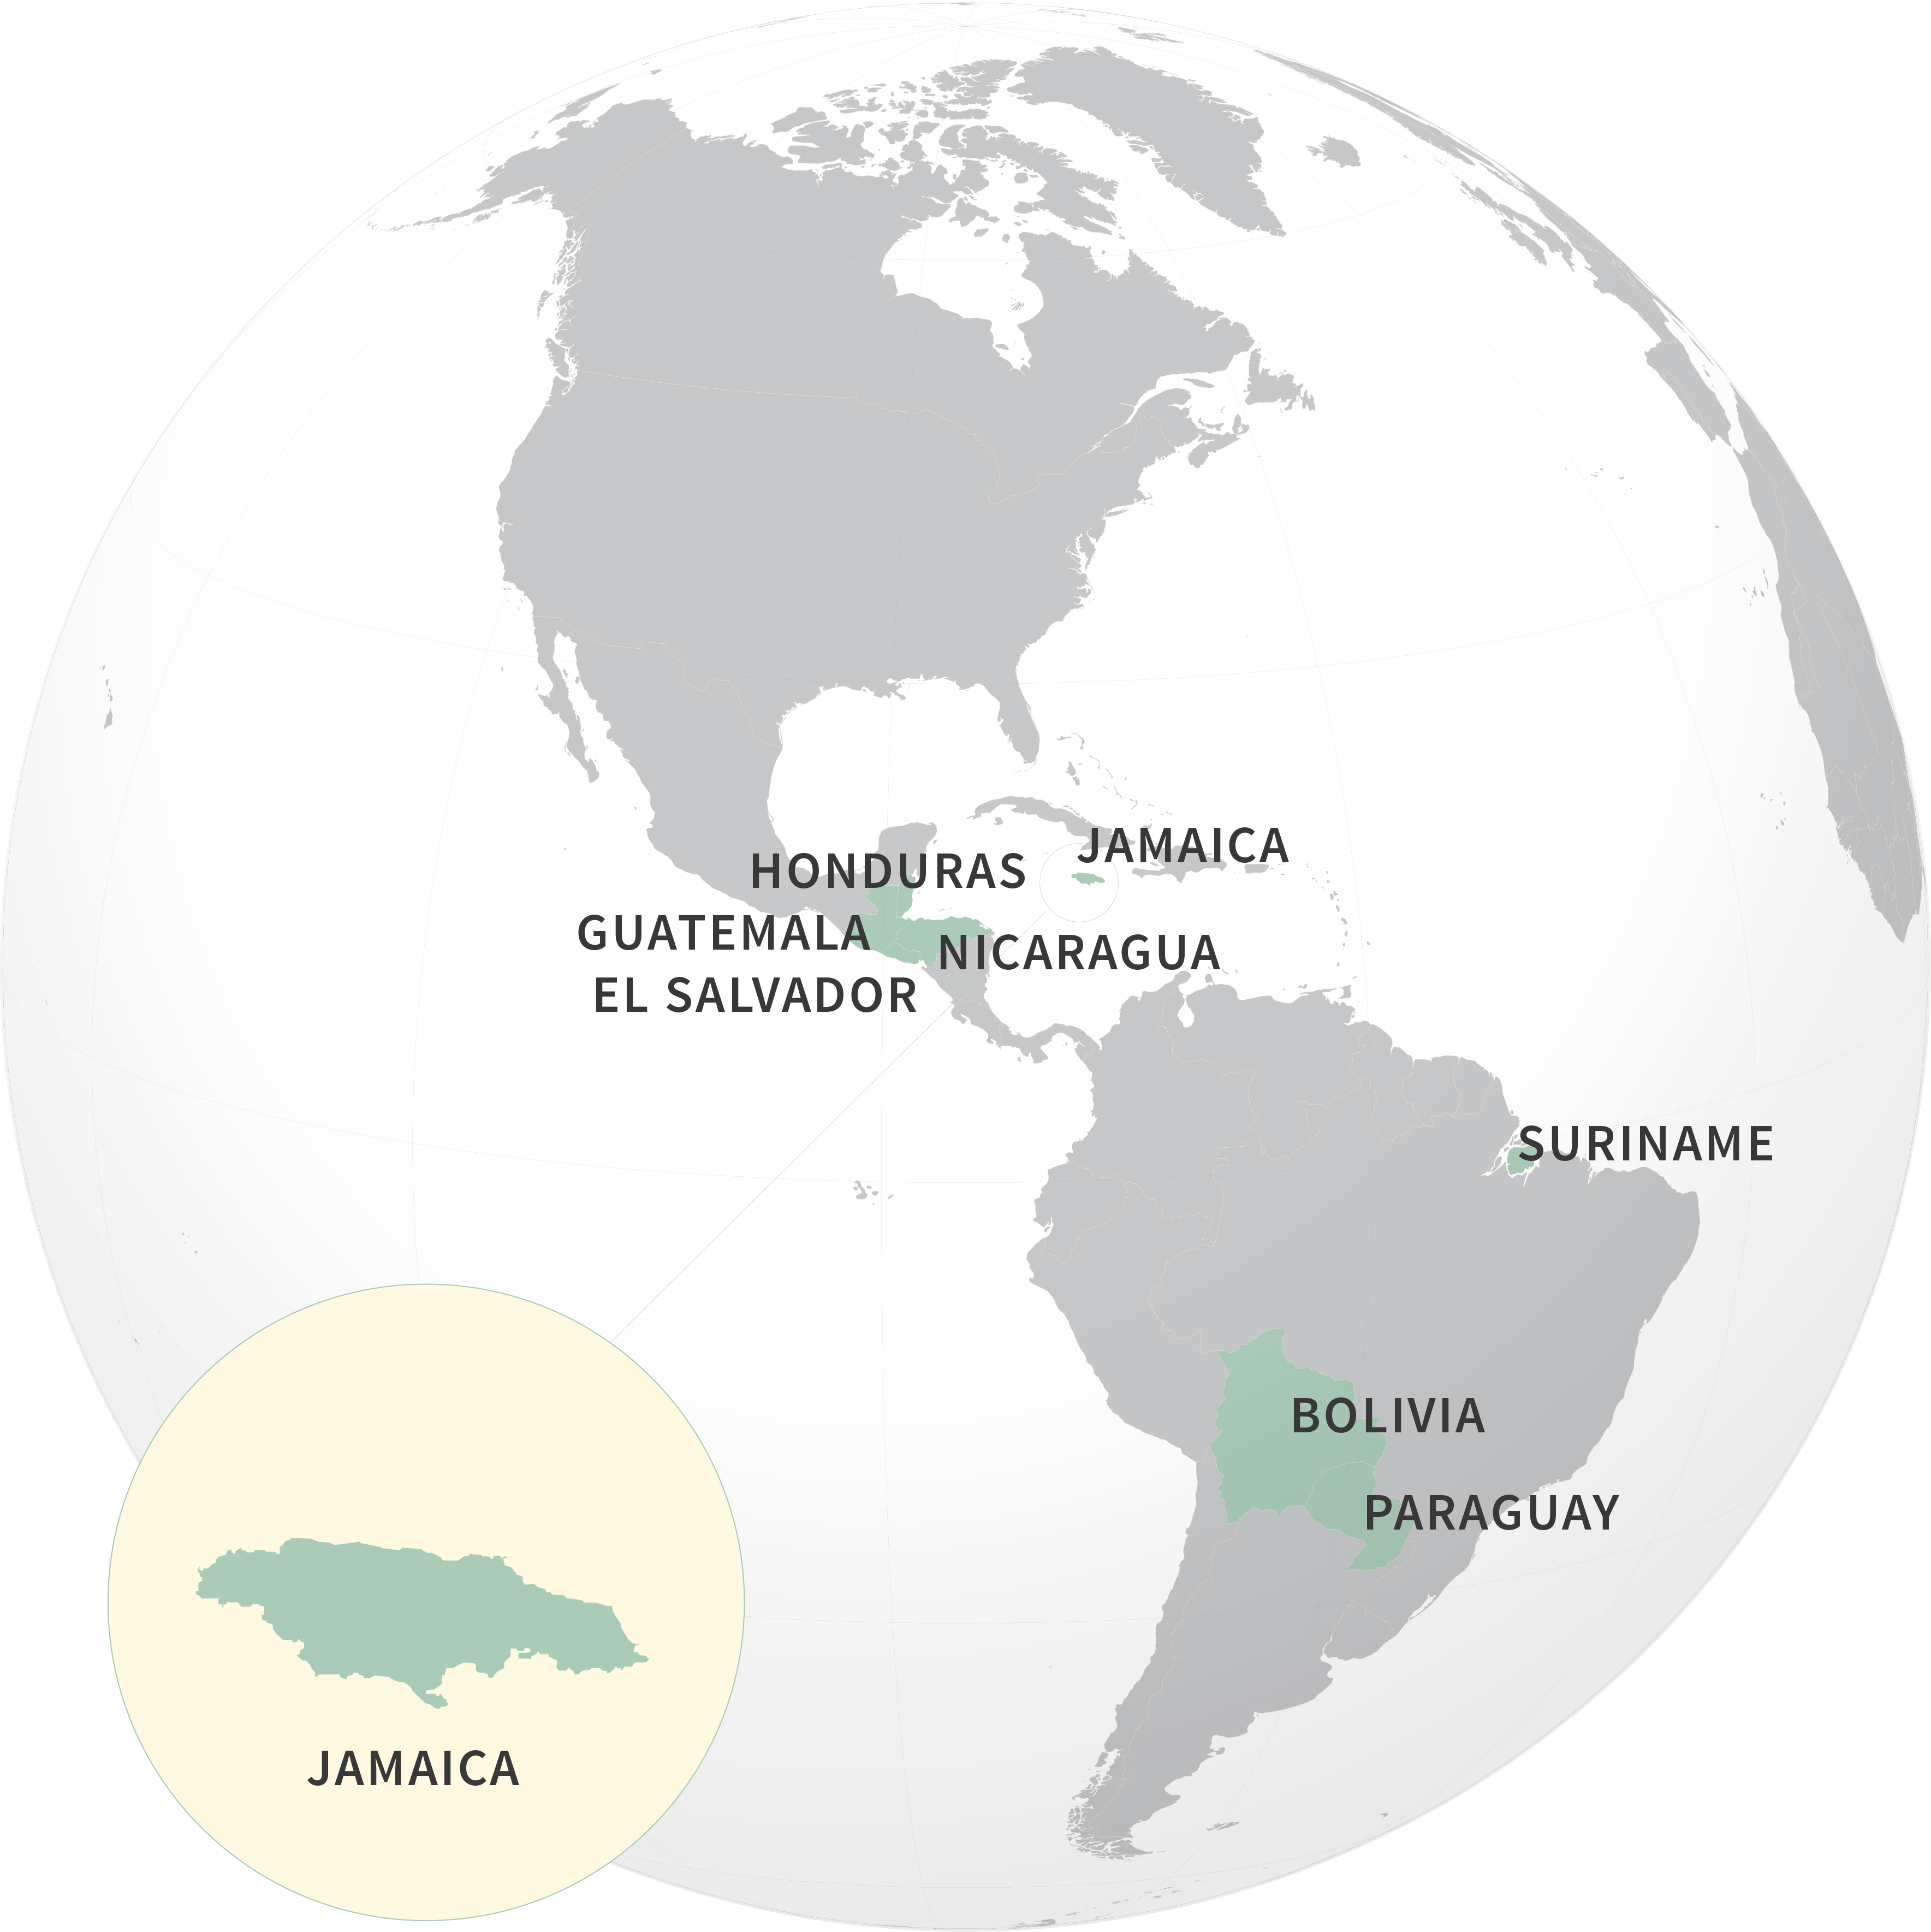
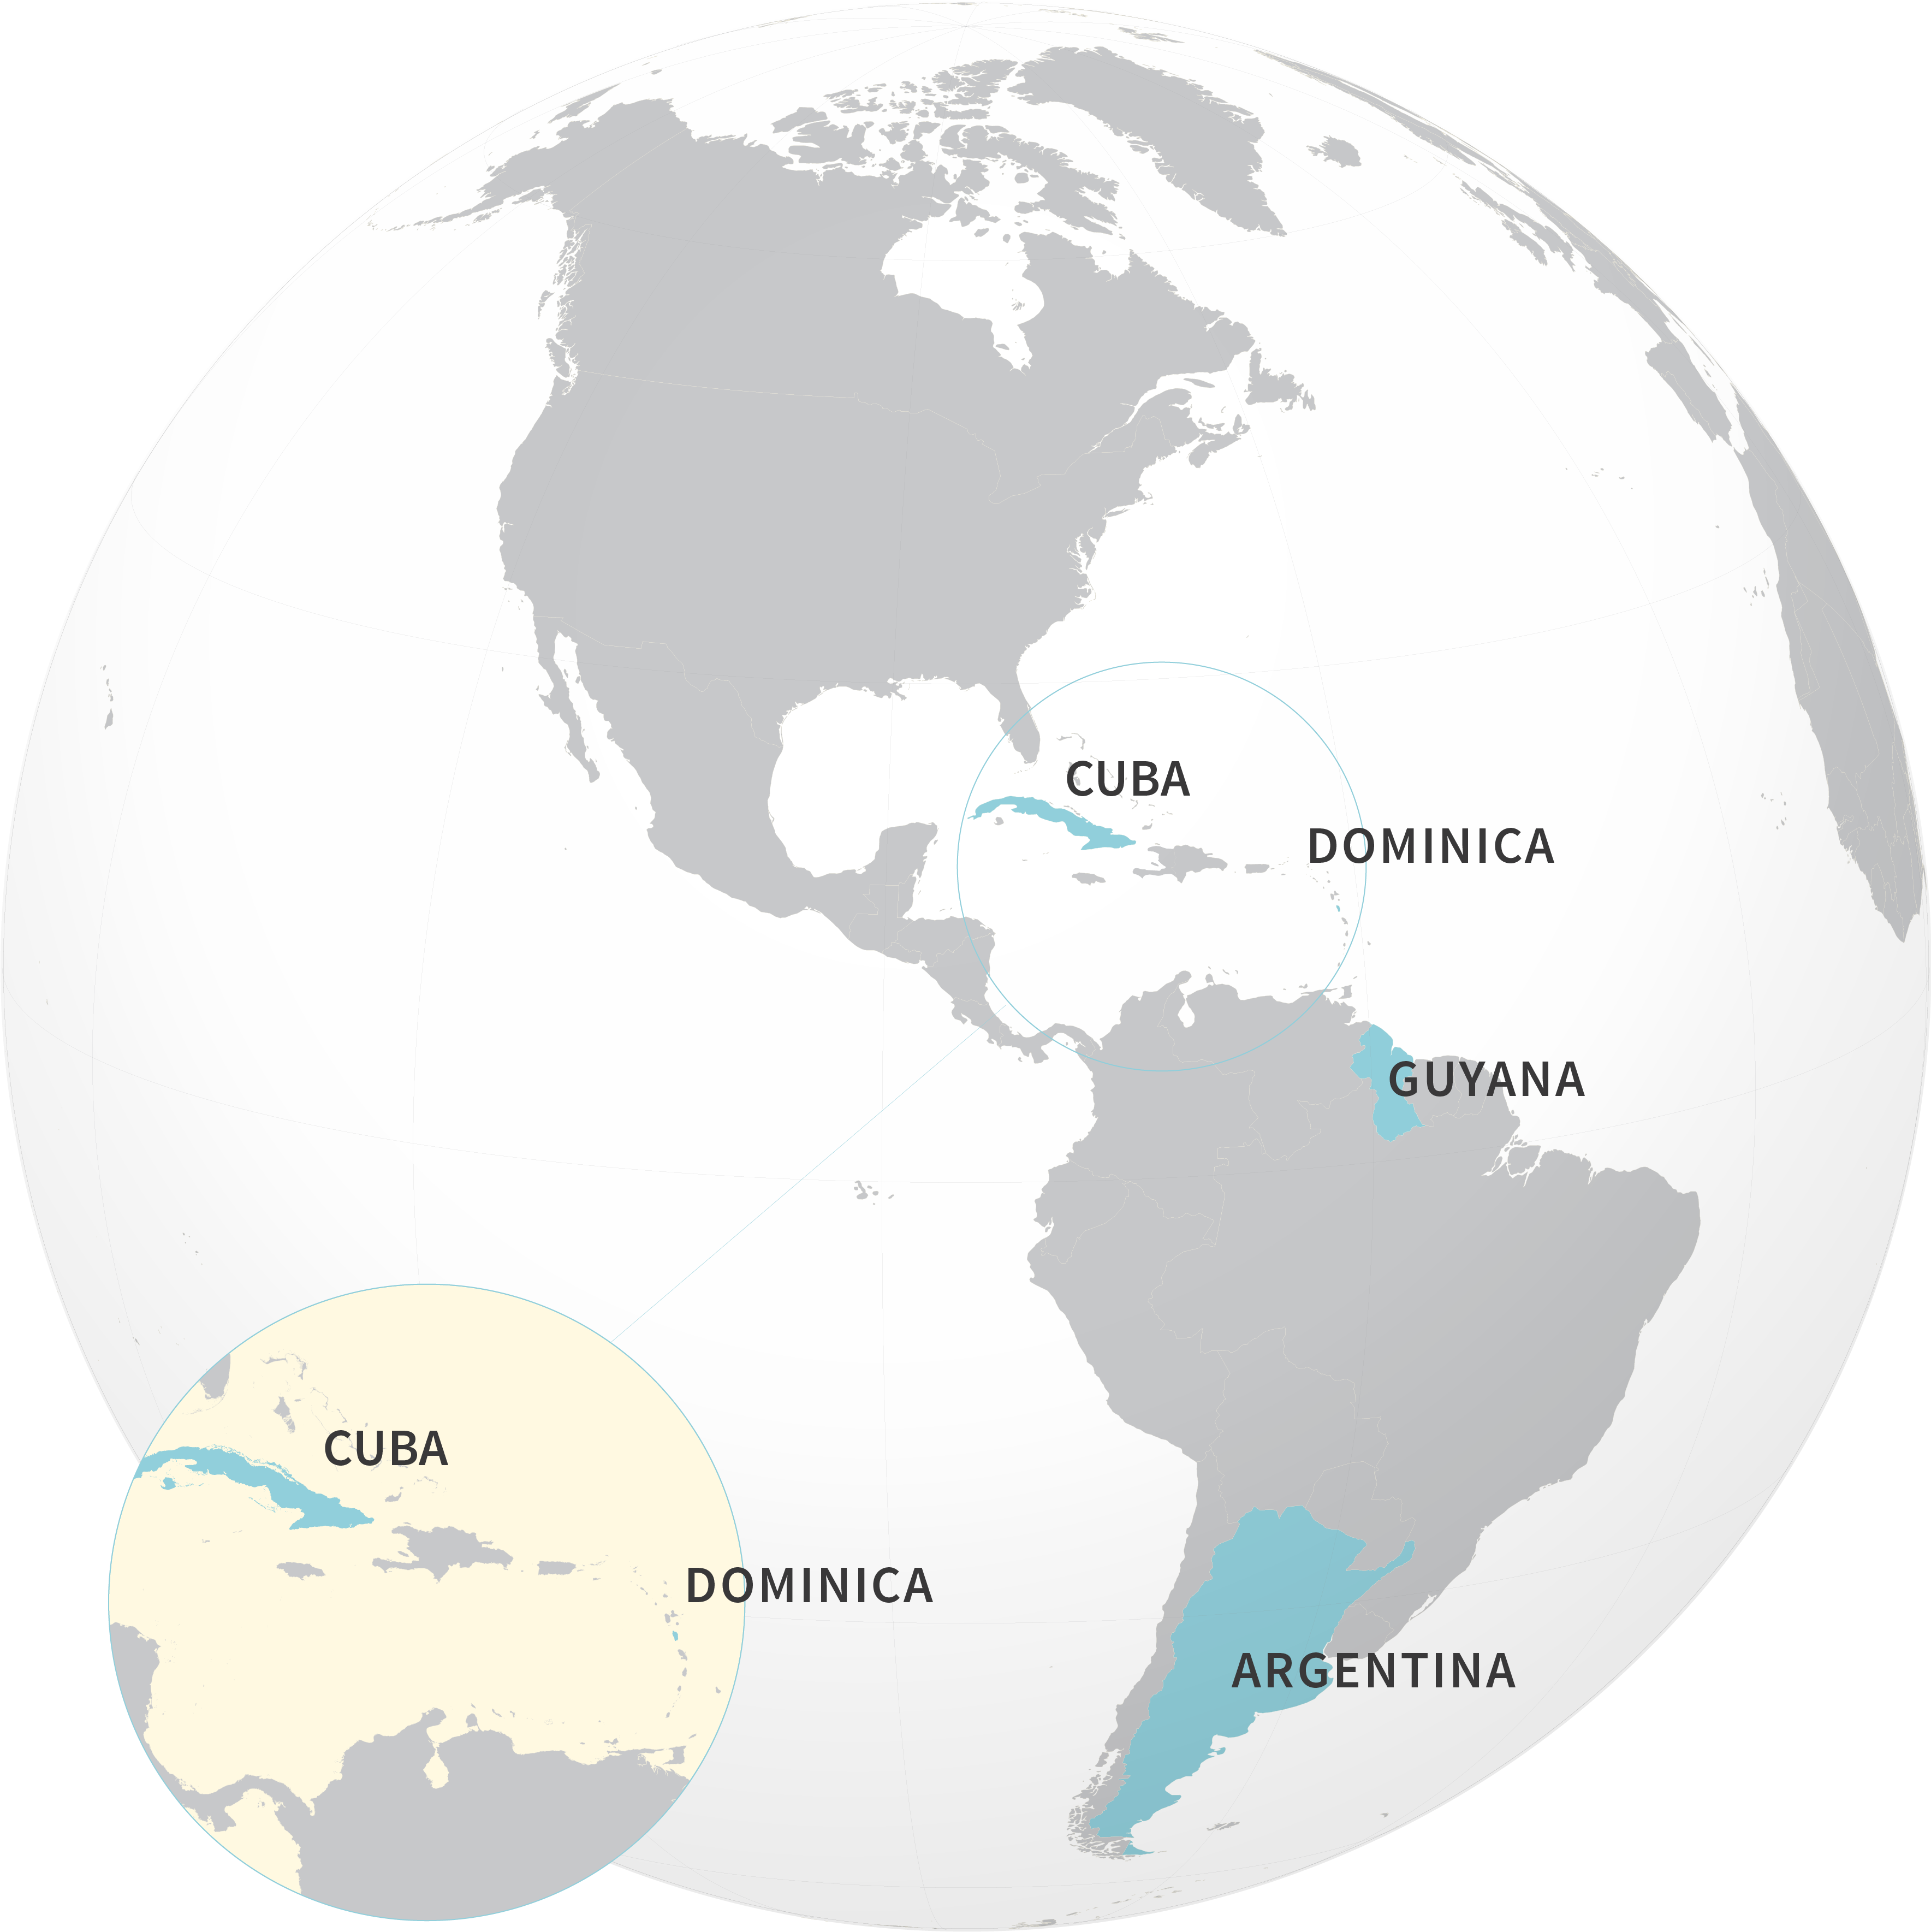
the Americas
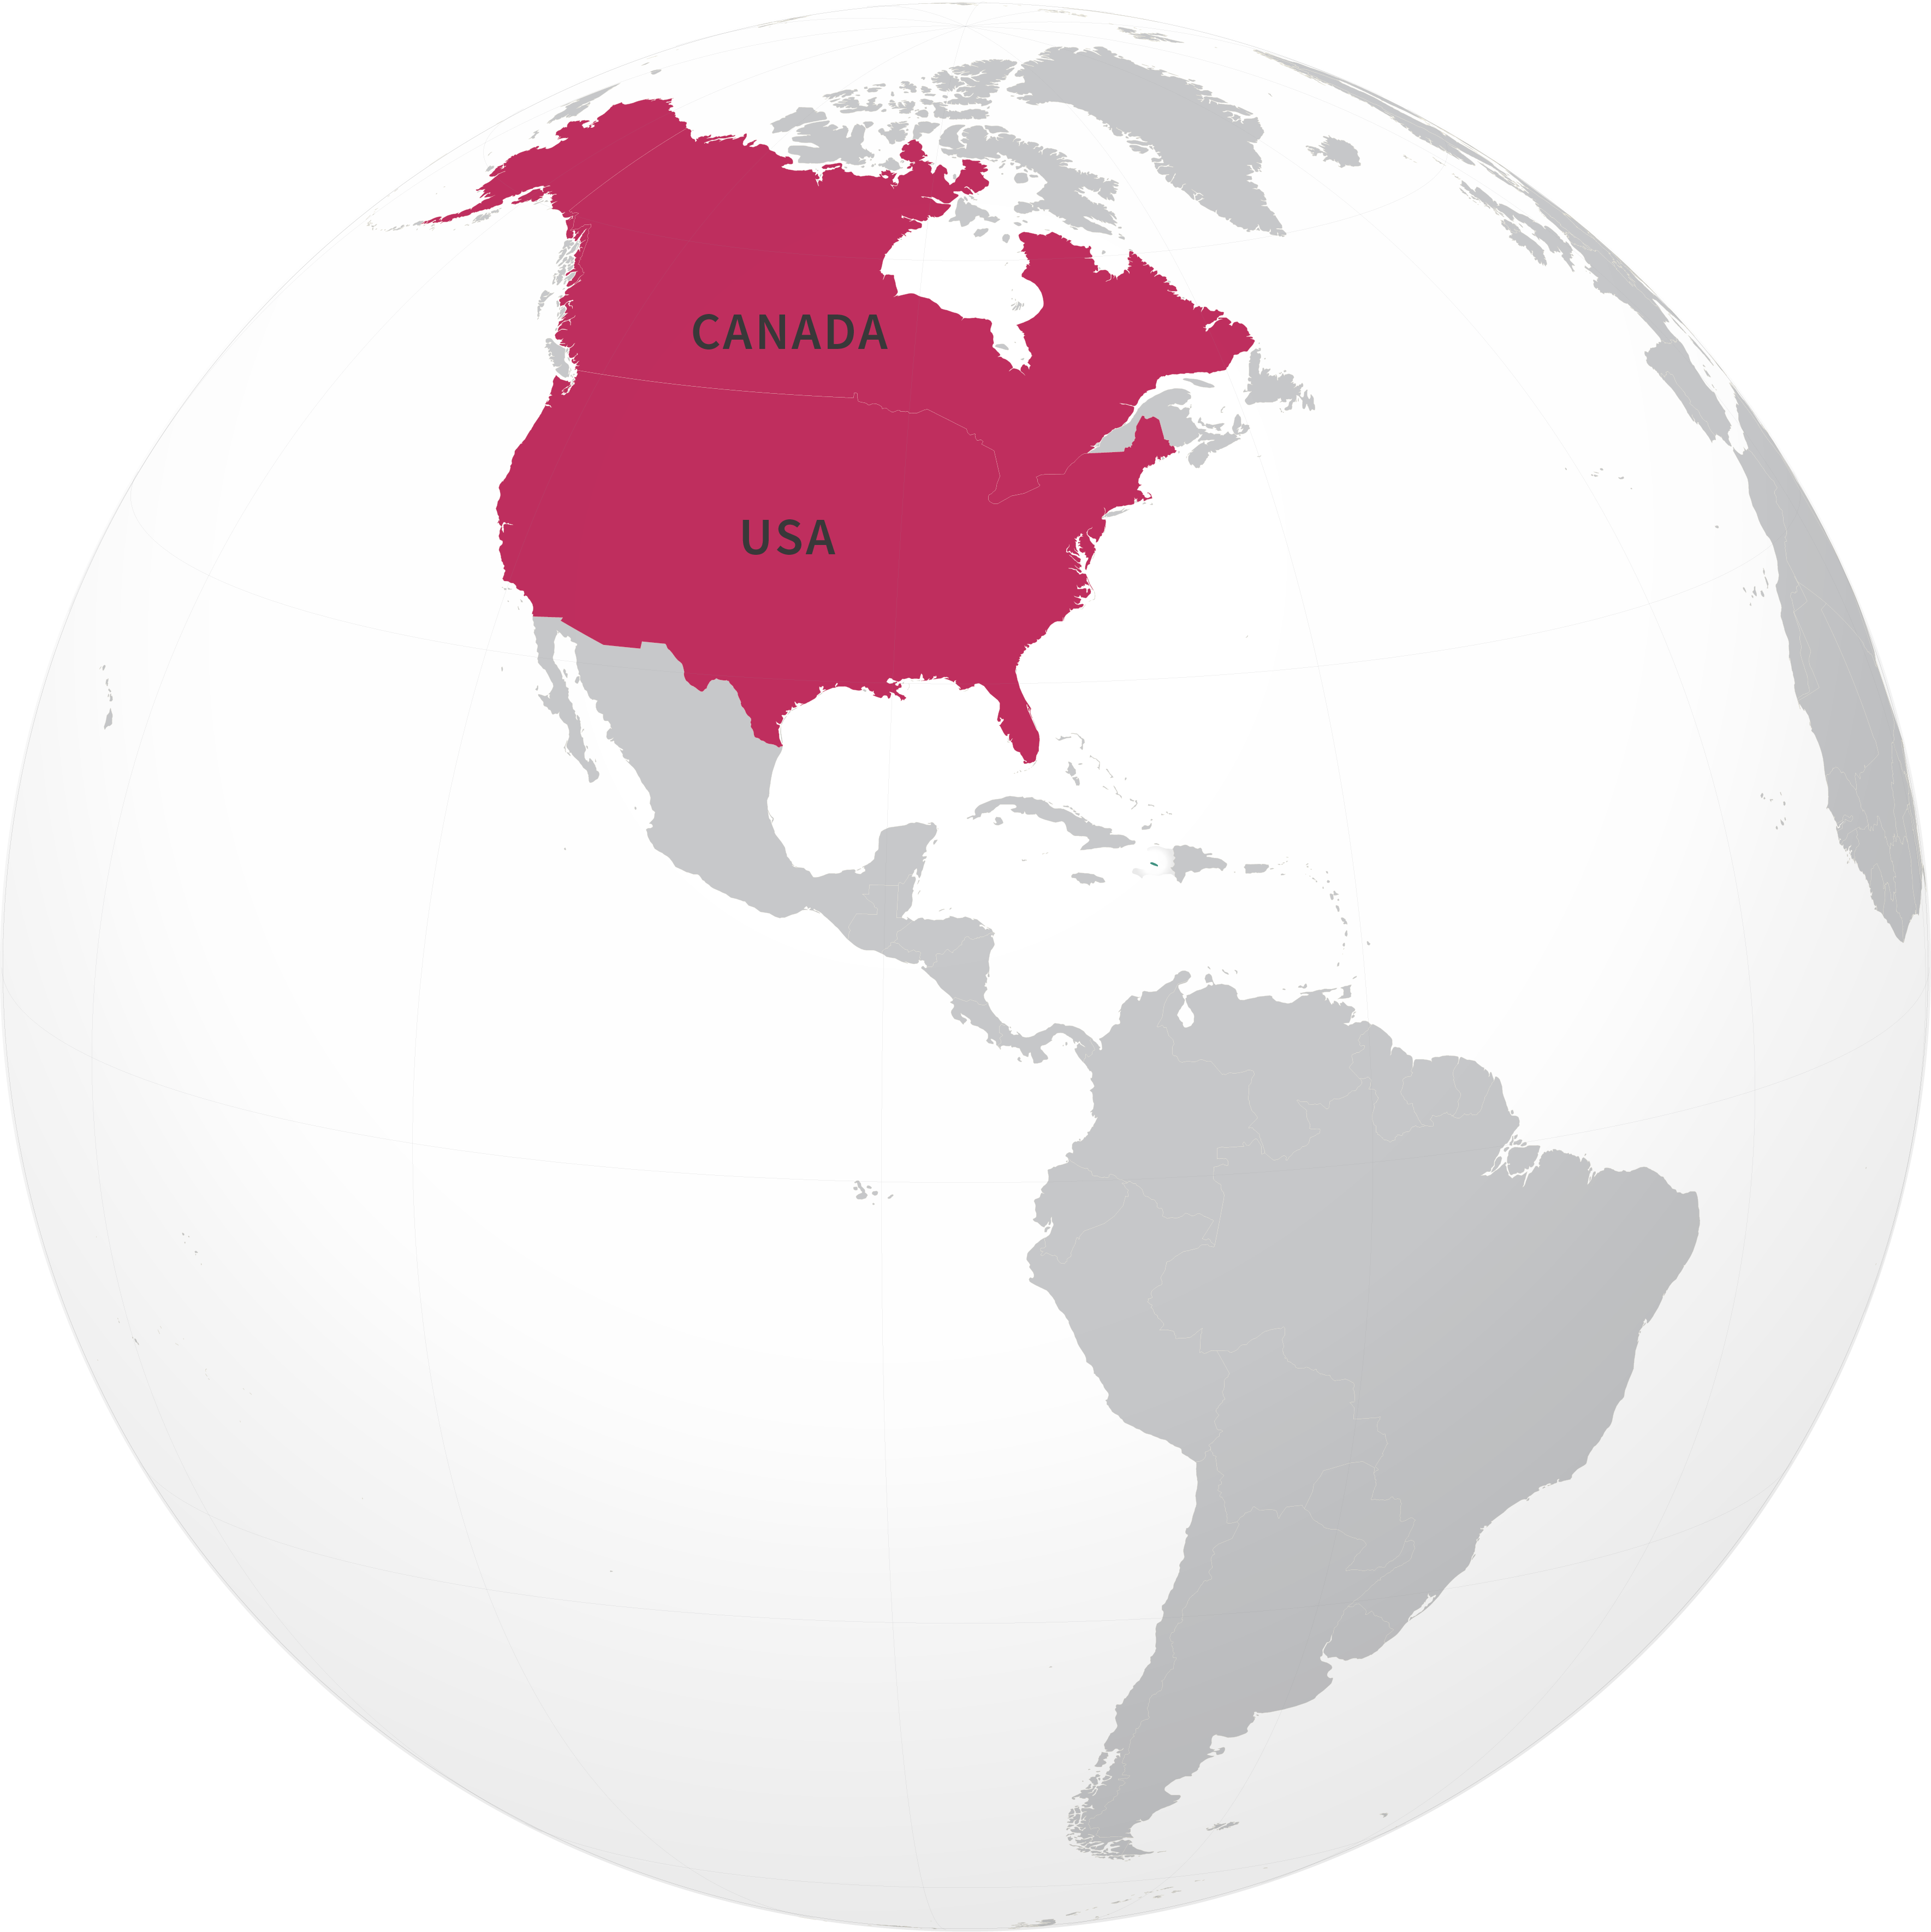
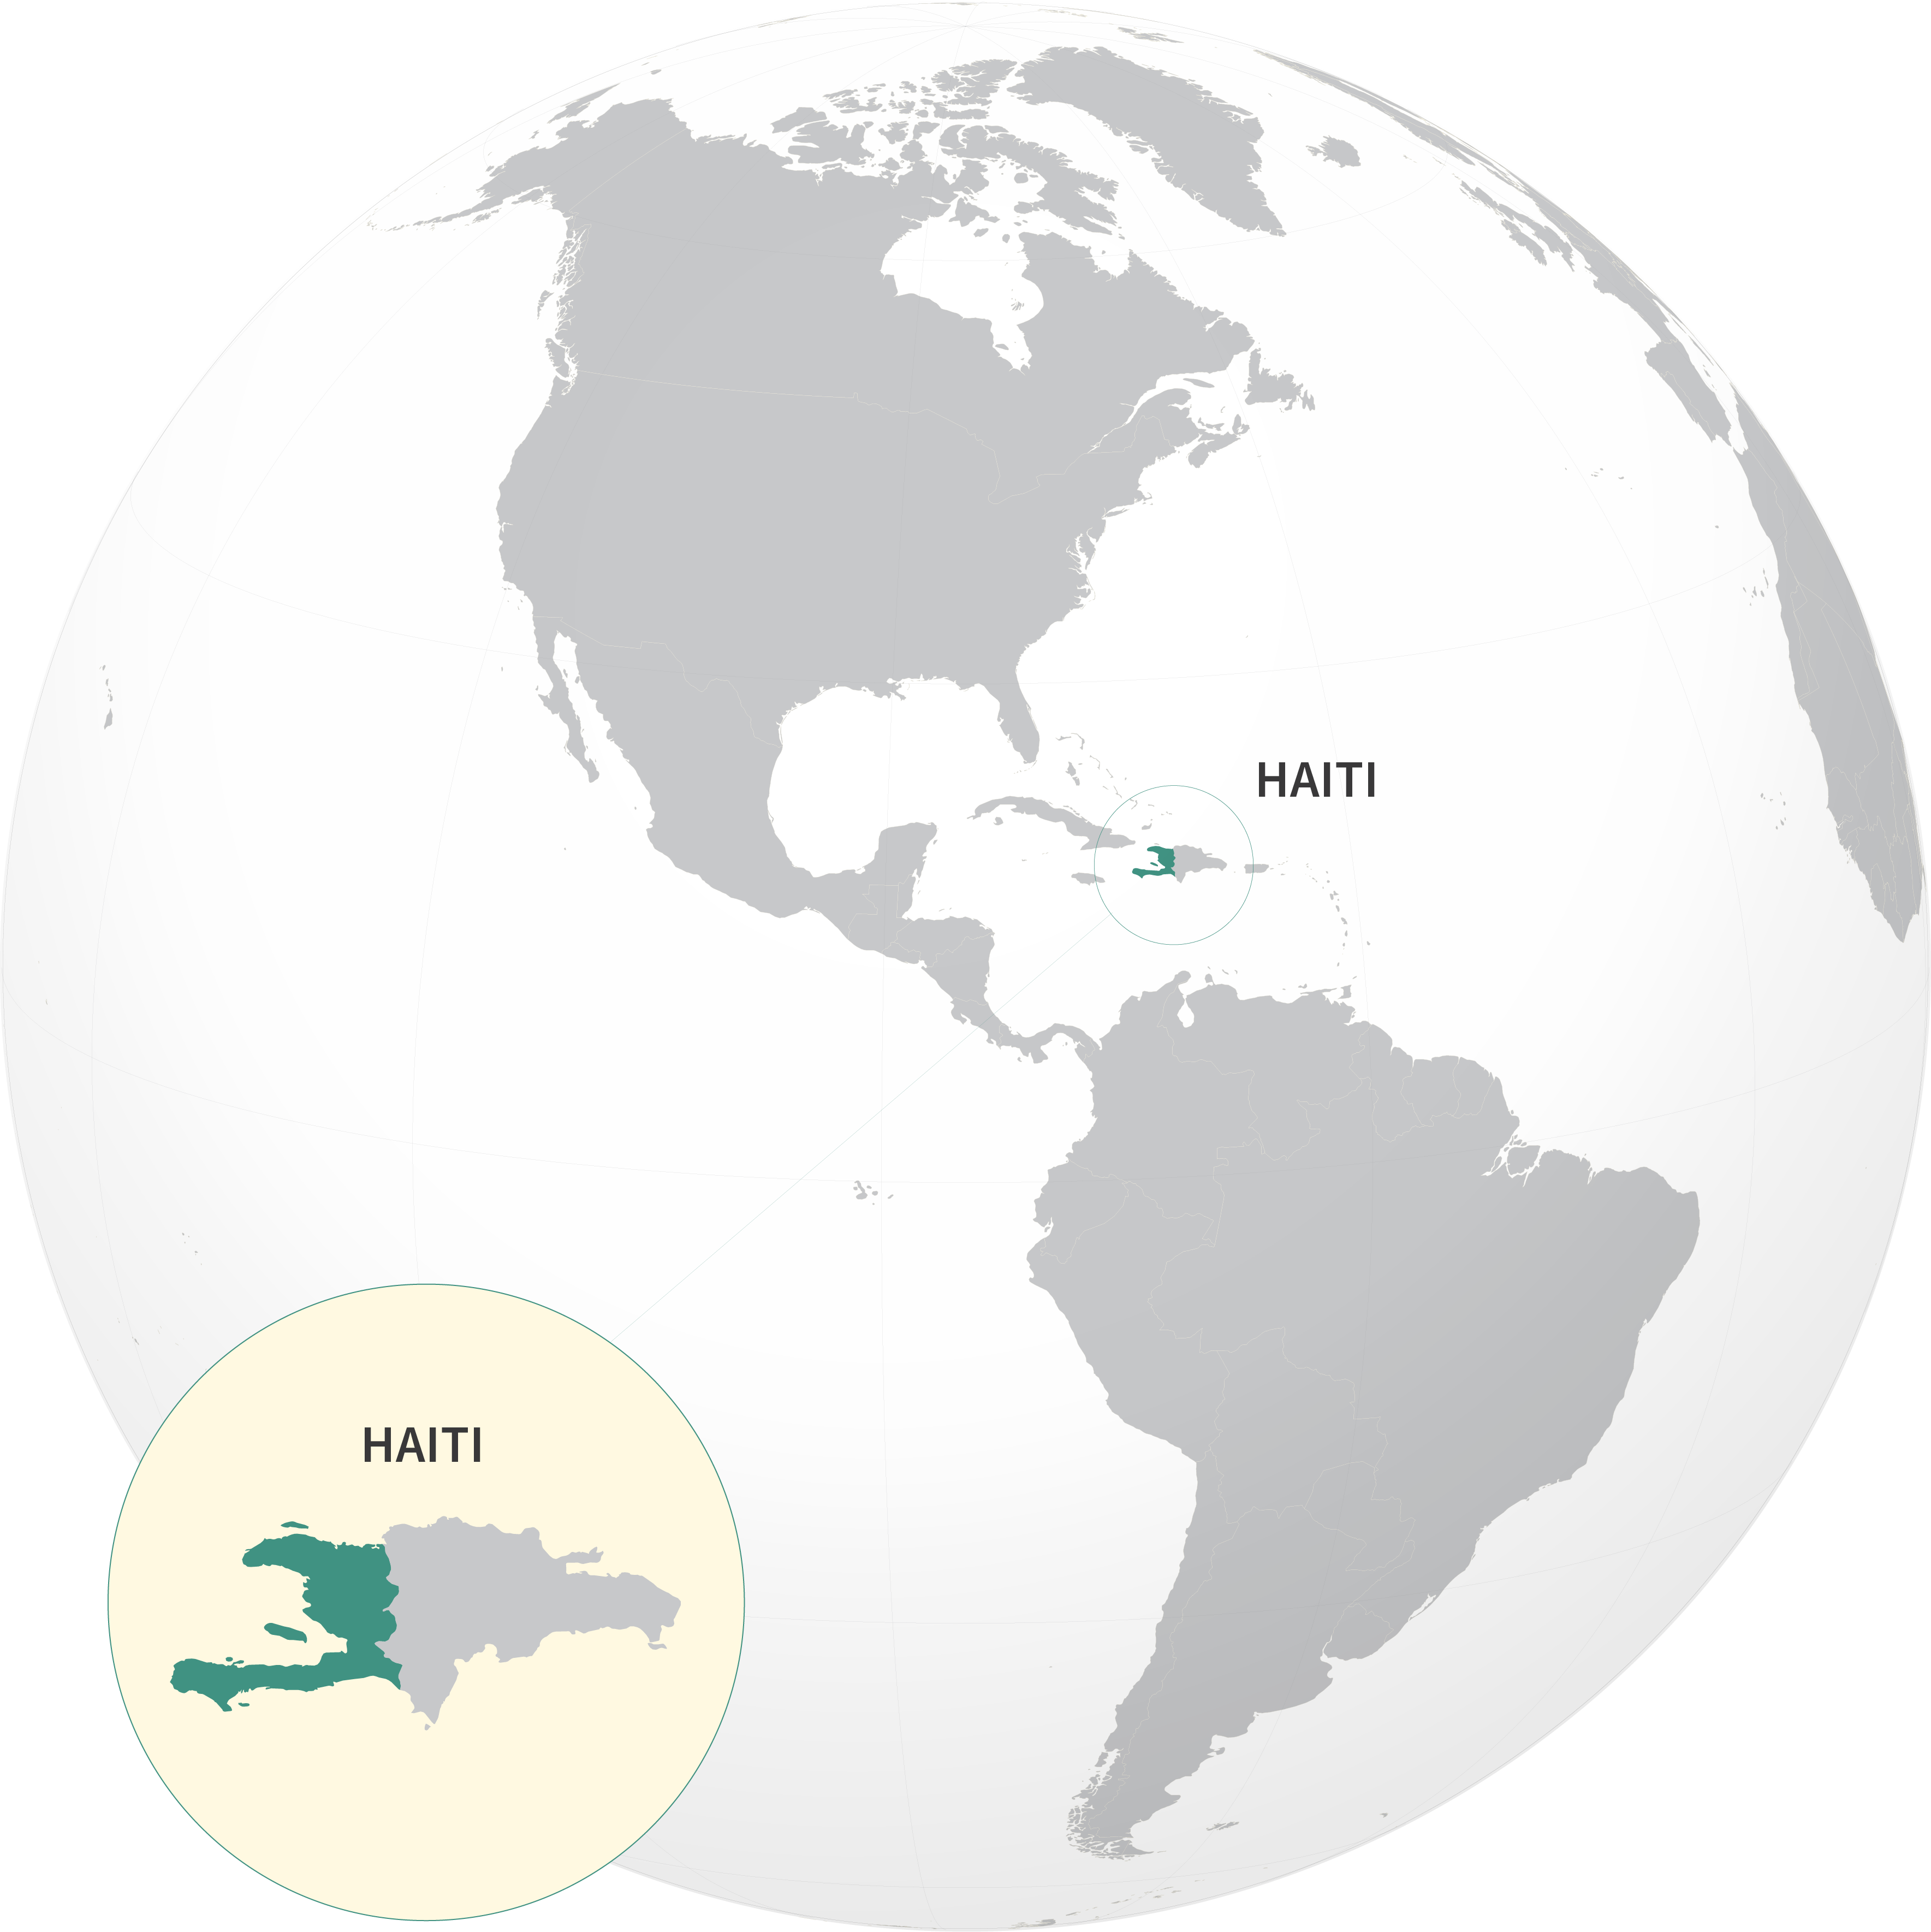
We choose to take the American continent as the most satisfactory one to create models of analysis as complete as possible.
The continent has a lot of internal differences from every point of view: economical, territorial, social and political. Furthermore Americas have two of the borderlines case, that are United States of America, as reference for a well-fixed situation, and Haiti, as one of the world’s poorest country, as well as countries that live in adequate conditions.
Index of stability
Speaking about stability, we consider the adequacy of foreign exchange reserves to pay for food imports as a percentage. The extreme cases, as shown by the size of the circular shape, are Argentina, the smallest with a good balance between the cost of import over export, and on the opposite Grenada, in which imports have a strong effect on the earnings from exportations.
Imports over exports

From a political perspective, it’s analysed the political stability and absence of violence. The index is a perception of the population, that place itself from a range of “completely stable” to the sensation of destabilization, due to violence and terrorism.


Economic Access
The availability of food, due to the economical and political stability of a country, does not guarantee in itself food security, that also depends on population and prices. That’s way we connect the Gross Domestic Product per capita (purchasing power of the population), the Domestic Food Price level (that compares the relative price of food across countries and over time) and the dietary energy Supply, in order to define six clusters. Each cluster has data that define a specific link between market and individual.
- ALL
- G1
- G2
- G3
- G4
- G5
- G6
HIGHEST ACCESS
Highest purchasing power and supply, with lowest prices.
LOWEST ACCESS
Lowest purchasing power and supply, with highest prices.
WELL-FIXED ACCESS
Medium-high purchasing power and supply, with medium-high prices. .
AVERAGE ACCESS
Average purchasing power, prices and supply.
LOWISH ACCESS
Purchasing power and supply generally low, with high prices.
NA
Access To food
Here’s the detail of the Gross Domestic Product per capita and the Domestic Food Price level, specific for each cluster, so that we make clear the economic access to food of the groups of American countries. As shown in the graphs, the first and the second group are opposite; again it’s evident the gap between the borderlines USA, together with Canada, and Haiti, that is alone in the second one.
General Average


supply against reuirements

G1
Canada
USA
G2
Haiti
G3
Trinidad-T.
Bahamas
Chile
S.Kitts-Nevis
G4
Belize
Antigua-B.
Colombia
Grenada
S-Lucia
Dominic. R.
Costa Rica
Peru
Ecuador
S. Vincent-G.
Barbados
Brazil
Panama
Uruguay
Mexico
Venenzuela
G5
Jamaica
El salvador
Paraguay
Nicaragua
Bolivia
Honduras
Guatemala
Suriname
G6
Argentina
Cuba
Dominica
Guyana
Food Balance
The supply of food is the third parameter considered for the cluster analysis. In the first chart we show the data of the food supply, that is in kg per capita per year. Speaking about food, we all know that “energy requirement is the amount of food energy needed to balance energy expenditure in order to maintain body size, body composition and a level of necessary and desirable physical activity consistent with long-term good health”.(FAO). That’s why we decide to compare the amount of real supplies of the population with the Average Dietary Energy Requirement (ADER), focusing on the percentage in excess or in deficiency, underlining that Haiti is the only country where the food requirement is not reached.
But what do they actually eat?


G1
Canada
USA
G2
Haiti
G3
Trinidad-T.
Bahamas
Chile
S.Kitts-Nevis
G4
Belize
Antigua-B.
Colombia
Grenada
S-Lucia
Dominic. R.
Costa Rica
Peru
Ecuador
S. Vincent-G.
Barbados
Brazil
Panama
Uruguay
Mexico
Venenzuela
G5
Jamaica
El salvador
Paraguay
Nicaragua
Bolivia
Honduras
Guatemala
Suriname
G6
Argentina
Cuba
Dominica
Guyana
Nutritional Availability
(or resources)
The possibility to reach the necessary amount of food in order to keep the recommended level of dietary energy intake is influenced by the Dietary Energy Supply (DES), that is the food available for human consumption, estimated for each country of the world. Comparingr to DES and relating to our six groups, we focus on three fundamental information that express the quality of life: the energy supply provided by cereals, roots and tubers, the supply of proteins of animal origin and the supply of proteins of vegetal origins.
- G1
- G2
- G3
- G4
- G5
- G6


G1
Canada
USA
G2
Haiti
G3
Trinidad-T.
Bahamas
Chile
S.Kitts-Nevis
G4
Belize
Antigua-B.
Colombia
Grenada
S-Lucia
Dominic. R.
Costa Rica
Peru
Ecuador
S. Vincent-G.
Barbados
Brazil
Panama
Uruguay
Mexico
Venenzuela
G5
Jamaica
El salvador
Paraguay
Nicaragua
Bolivia
Honduras
Guatemala
Suriname
G6
Argentina
Cuba
Dominica
Guyana
Keep eat right
Finally, here we introduce a summary from the previous indexes, in order to show the status quo of the American continent on food security. In particular, we want to emphasise the differences between the dietary energy requirement, established as the most appropriate for each country, and the actual level of food supply of the population.
Import over exports is the quantity of exportations’ profit reserves to pay for imports; an higher number correspond to a lower profit.
The indicator of political stability is a personal perception of the citizen.
Economical Access is the combination of three causes, that are the Gross Domestic Product per capita, the Domestic Food Price level and the dietary energy Supply. The final value is an average, so that if one of the three indexes is particularly high, it will change the position of the country in the graph (it’s necessary to read separately the data of three indexes from the Economic Access’ section of the website).
Dietary Requirement is the amount of food energy needed to balance energy expenditure.
Made by the combination of these four coordinates, the graph displays an overview, in which we can find three particular situations: Canada and United States of America, Haiti, Panama.
Canada and United States of America are the the “Highest access” group, as confirmed by the “Imports over exports” and the “Economical Access” with the highest purchasing power and the lowest prices and by the population that feel a positive perception of social and political stability. The other side is the highest percentage of supply in relation to the balanced requirement.
Haiti experiences the opposite situation, with the lowest purchasing power and supply, due to the highest prices


project by
- Carola Barnaba
- Maddalena Bernasconi
- Chiara Bonsignore
- Giada Casella
- Eyleen Carolina Camargo
- Carlo Colombo
Faculty
- Paolo Ciuccarelli
- Marco Fattore
- Stefano Mandato
- Michele Mauri
- Salvatore Zingale
Teaching Assistants
- Matteo Azzi
- Angeles Briones
- Daniele Ciminieri
- Gabriele Colombo
- Azzurra Pini