THE

UNKNOWN
MIGRATION

People has always travelled around Europe. Thanks to the agreements between the European countries the phenomenon is widely increased in the recent years.
Here you can find an overview of the migration inside the European Economic Area (EEA).
MIGRANTS
AND POPULATION
The EEA is an organization that provides for the free movement between the 28 EU member states, as well as Iceland, Liechtenstein, Switzerland and Norway.
Here you can compare some numbers: the amount of migrants in relation with the total population in each member state.
EUROPEAN ECONOMIC AREA
population: 520,060,857
immigrants: 56,676,092
AUSTRIA
population: 8,451,860
immigrants: 1,397,766
BELGIUM
population: 11,161,642
immigrants: 1,702,542
BULGARIA
population: 7,284,552
immigrants: 86,837
CROATIA
population: 4'262,140
immigrants: 756,980
CYPRUS
population: 865,878
immigrants: 207,313
CZECH REPUBLIC
population: 10,516,125
immigrants: 745,200
DENMARK
population: 5,602,628
immigrants: 556,825
ESTONIA
population: 1,320,174
immigrants: 197,611
FINLAND
population: 5,426,674
immigrants: 293,167
FRANCE
population: 65,560,721
immigrants: 7,456,145
GERMANY
population: 82,020,578
immigrants: 11,110,943
GREECE
population: 10,991,400
immigrants: 988,245
HUNGARY
population: 9,908,798
immigrants: 472,798
ICELAND
population: 321,857
immigrants: 35,395
IRELAND
population: 4,591,087
immigrants: 752,500
ITALY
population: 59,685,227
immigrants: 5,766,163
LATVIA
population: 2,023,825
immigrants: 323,642
LITHUANIA
population: 2,971,905
immigrants: 221,462
LUXEMBURG
population: 537,039
immigrants: 229,409
MALTA
population: 421,364
immigrants: 34,455
NETHERLANDS
population: 16,779,575
immigrants: 1,964,922
NORWAY
population: 5,051,275
immigrants: 692,040
POLAND
population: 38,062,535
immigrants: 663,755
PORTUGAL
population: 10,487,289
immigrants: 893,847
ROMANIA
population: 20,020,074
immigrants: 198,839
SLOVAKIA
population: 5,410,836
immigrants: 158,100
SLOVENIA
population: 2,058,821
immigrants: 365,560
SPAIN
population: 46,727,890
immigrants: 6,618,000
SWEDEN
population: 9,555,893
immigrants: 1,453,645
SWITZERLAND
population: 8,039,060
immigrants: 2,480,941
UNITED KINGDOM
population: 63,905,297
immigrants: 7,838,837
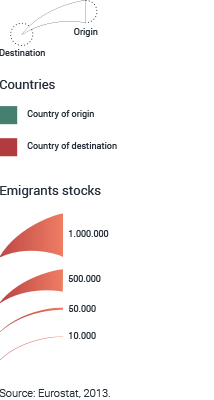
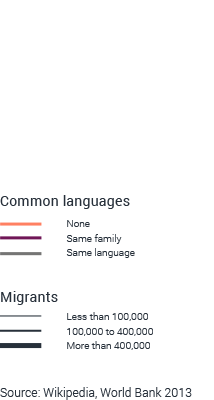
Source: World Bank, 2013; Eurostat, 2013.

MIGRATION FLOWS IN 2013

In 2013 almost three million people left their countries to reach one of the EEA countries. Despite the public opinion only half of them came from other continents.
Source: Eurostat, 2013.
AN OVERSHADOWED
EUROPEAN MIGRATION IS OFTEN OVERSHADOWED BY THE MORE
DISCUSSED TOPIC OF INTERNATIONAL MIGRATION. THAT’S WHY WE
WOULD LIKE TO DIVE DEEPER IN THIS PHENOMENON AND DISCOVER
WHERE DO EUROPEANS GO AND WHY DO THEY MOVE.
HUGE PHENOMENON
MIGRATION GLOSSARY
Several terms are used to describe people who migrate, but often we don’t know the differences.
Let’s start with some clarifications.

MIGRANT

A migrant is someone who moves from one place to another in order to live in another country for more than a year.

REFUGEE

A person living out of its mother country and unable or unwilling to return there for fear of being persecuted for race, religion, political opinion or other such reasons.

ASYLUM SEEKER

A person awaiting a decision for his application for asylum, i.e. the protection status offered by EU countries to people in peril of unfair prosecution.
Sources: www.theguardian.com / www.unhcr.org

EUROPEAN ASYLUM SEEKERS

There are very few europeans who claim for asylum between the ones who move. And when we say very few we are speaking about 1 out of 3600.
Source: Eurostat, 2013.

WHERE ARE THE MIGRANTS?

Which are the most common destinations, and from where to where do europeans move? Let’s explore the situation in detail.
2010 2013
Italy Austria Belgium Bulgaria Croatia Cyprus Czech Republic Denmark Estonia Finland France Germany Greece Hungary Iceland Ireland Latvia Liechtenstein Lithuania Luxembourg Malta Netherlands Norway Poland Portugal Romania Slovakia Slovenia Spain Sweden Switzerland United Kingdom Austria Belgium Bulgaria Croatia Cyprus Czech Republic Denmark Estonia Finland France Germany Greece Hungary Iceland Ireland Italy Latvia Liechtenstein Lithuania Luxembourg Malta Netherlands Norway Poland Portugal Romania Slovakia Slovenia Spain Sweden Switzerland United Kingdom Destination Origin
WHAT FACTORS COULD
WE SAW THAT ALMOST NONE OF THE EUROPEAN MIGRANTS RUN AWAY
FROM THEIR COUNTRY IN SEARCH OF ASYLUM. IF THEY ARE NOT FORCED
TO MOVE, WHY DO THEY LEAVE AND HOW DO THEY DECIDE WHERE TO GO?
THERE ARE “PUSH” AND “PULL” FACTORS THAT RESPECTIVELY PUSH
MIGRANTS AWAY FROM THEIR COUNTRY OR THAT ATTRACT MIGRANTS
IN A SPECIFIC COUNTRY. WE EXPLORED SIX POSSIBILITIES.
MIGRANTS CONSIDER?
  • Proximity
  • Language
  • Income & cost of life
  • GDP per capita
  • Quality of life
  • Labour demand
The distance between origin and destination state could be a factor that influences migrants’ choices. The nearer the better. In order to check out this hypothesis we considered only emigrants flows higher than 10% on the total emigrants of a state.
Cyprus I c eland P o r tugal Spain F r ance G r eece Italy Bulga r ia Romania C r oatia Hunga r y Malta Sl o v enia Swit z erland A ustria Sl ov akia C z ech Republic P oland Germany Liechtenstein Netherlands Netherlands Netherlands Netherlands Belgium L u x embou r g Denmark Lithuania Latvia Es t onia Finland Sweden No r w a y United Kingdom I r eland F r ance Belgium Germany Netherlands L u x embou r g Belgium Germany Netherlands L u x embou r g A ustria Swit z erland Germany Liechtenstein Netherlands L u x embou r g Germany P oland Netherlands F r ance Belgium L u x embou r g Swit z erland A ustria Liechtenstein C z ech Republic Denmark Germany C z ech Republic Sl ov akia Lithuania Liechtenstein Netherlands L u x embou r g P oland C z ech Republic A ustria Germany Liechtenstein Netherlands L u x embou r g P oland Sl ov akia Sl ov akia P oland C z ech Republic A ustria Hunga r y A ustria Italy Swit z erland Germany Liechtenstein C z ech Republic Sl ov akia Hunga r y Sl o v enia F r ance Germany L u x embou r g Liechtenstein A ustria Italy Swit z erland C r oatia Hunga r y A ustria Italy Sl o v enia Malta Italy Hunga r y Sl ov akia A ustria C r oatia Sl o v enia Romania C r oatia Sl o v enia Hunga r y Romania Bulga r ia Hunga r y Bulga r ia G r eece Romania G r eece Bulga r ia Italy Spain F r ance P o r tugal Belgium L u x embou r g P o r tugal Spain F r ance Spain Italy Swit z erland Germany Belgium L u x embou r g Liechtenstein United Kingdom Italy F r ance A ustria Liechtenstein Swit z erland Sl o v enia L u x embou r g Belgium F r ance Germany Belgium L u x embou r g Liechtenstein Denmark Germany Sweden Netherlands L u x embou r g Liechtenstein Lithuania Latvia P oland Latvia Es t onia Lithuania Es t onia Finland Latvia Finland Sweden Es t onia Sweden Finland No r w a y No r w a y No r w a y Sweden United Kingdom I r eland United Kingdom I r eland
Language could also determine the destination choices for intra-EEA migrants. The diagram shows the relation between countries speaking the same language and also between countries having languages that derive from the same family.
Migrants could be drawn by a wage differential. We intersected median net income and cost of life with the immigrants stocks in each country in order to see if the data confirm this assumption.
We tried to see if GDP per capita has a relationship with the percentage of population migrating abroad.
This visualization shows the relationship between how people perceive the quality of life in their country and the percentage of population migrating abroad.
We observed the unemployment rate in each country with its respective emigration rate. A common pattern between the countries is not easily visible.

IN CONCLUSION

Despite the complexity of the analyzed factors it is possible to recognize some patterns, which gather countries for behavioral similarities in immigration and emigration.
Immigration
Emigration
The first cluster groups countries characterized by good rankings in all of the considered factors. Despite this good positioning they are not always the countries that host more migrants.
Ireland has a peculiar behavior, that diverges from the others for an high immigrant rate and a bad positioning in the unemployment rate.
This cluster covers the middle slot of the chart except for the immigration rate, slightly higher, and the unemployment rate that is strongly different in these countries.
This group has low rankings in most of the parameters, apart from the overall life satisfaction, that shows an unexpected good positioning for some countries, and the unemployment rates, parameter that seems to be non influential in most of the clusters.
As one of the two outsiders of this analysis Romania is characterized by a high emigration rate, low GDP per capita and median income. What is unexpected is a fair ranking in overall life satisfaction and a pretty good employment situation.
Compared to their population these countries has the most migrants. They all have bad rankings in GDP per capita, median net income and overall life satisfaction. Still the unemployment rate scores are more diffused.
Despite the fact that this group covers the highest rankings in most of the parameters and tends to have low emigrant rates there are some exceptions. Luxembourg and Iceland have an high emigration rate.
Even if this group has only a median positioning regarding the economical parameters, it has the lowest emigration rate.
Ireland diverges from the others for an higher emigrant rate and a fare score in GDP per capita and median net income. It has a bad positioning in the unemployment rate.
Immigrantion rate GDP per capita GDP per capita Median net income Overall life satisfaction Unemployment rate Hungary Slovakia Portugal Finland Croatia Latvia Greece Estonia Lithuania Poland Romania Bulgaria Luxembourg Belgium Iceland Austria Norway Sweden Germany Denmark Netherlands Finland Ireland Cyprus Slovenia Spain United Kingdom Malta Czech Republic Italy Hungary France
Emigrantion rate GDP per capita Median net income Overall life satisfaction Unemployment rate Romania Ireland Cyprus Slovenia Malta Czech Republic Hungary Slovakia Portugal Croatia Latvia Greece Estonia Lithuania Poland Bulgaria Spain United Kingdom Italy France Luxembourg Belgium Iceland Austria Norway Sweden Germany Denmark Netherlands Finland
COMPLEX COMBINATION
WHAT EMERGES FROM THESE VISUALIZATIONS IS THAT THERE ISN'T
JUST ONE FACTOR THAT STAND OUT FROM THE OTHERS AS A MAIN INFLUENCER.
THE DECISION TO MOVE IS ALWAYS A COMPLEX COMBINATION OF REASONS.
OF REASONS