REVOLUTIONARY PROCESS
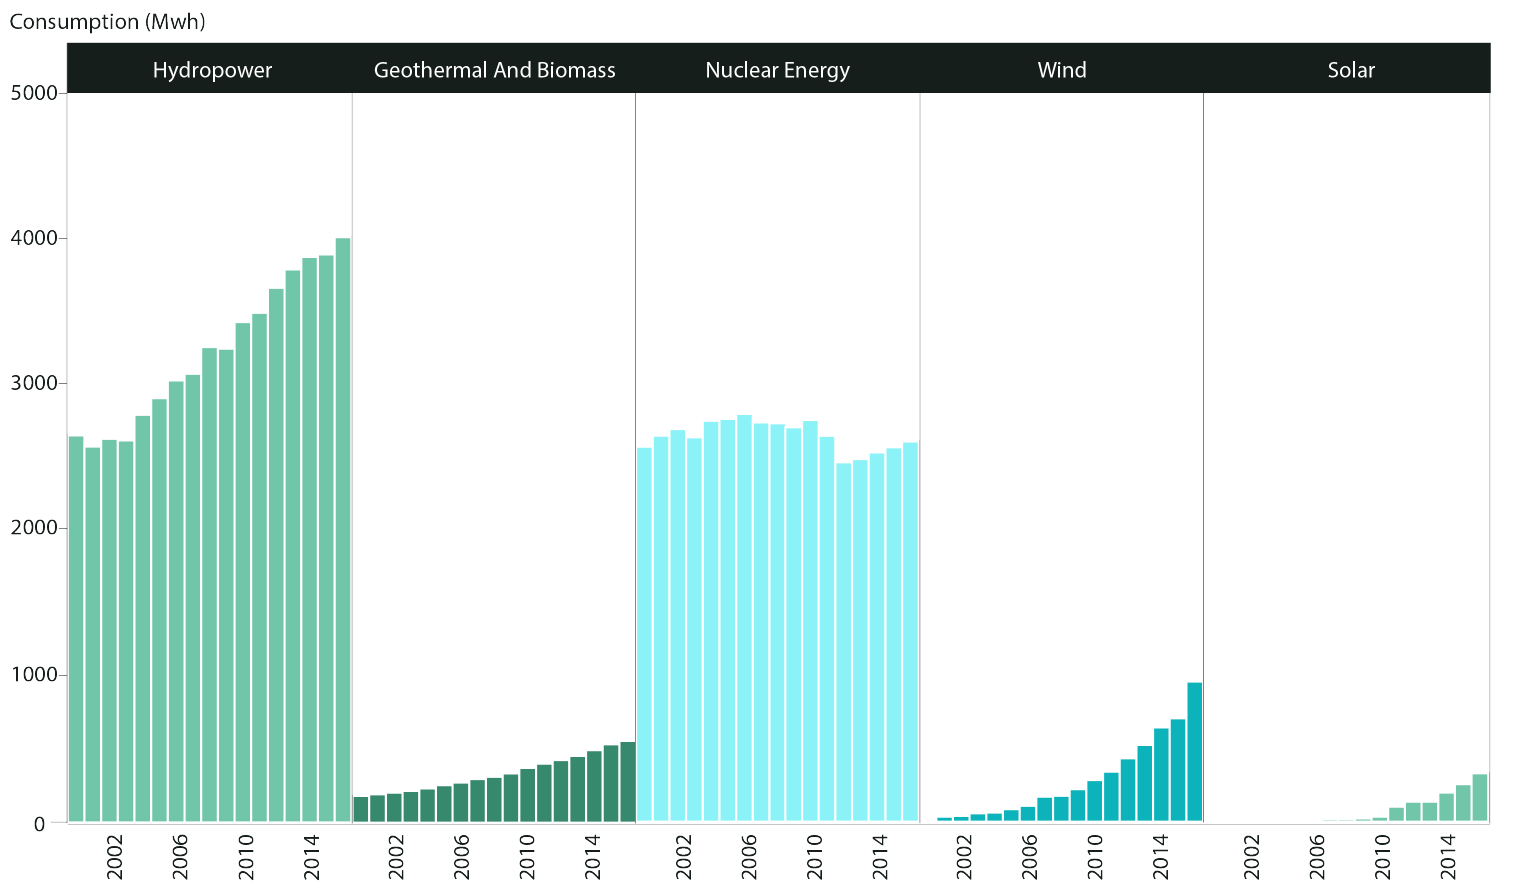
2000-2016 LOW-CARBON ENERGY CONSUMPTION IN THE GLOBLE
From 2000 to 2016, hydro power and nuclear energy accounted for a large proportion of the consumption of low-carbon energy.
Ban Ki-moon -- Secretary-General of the United Nations
David Attenborough -- English veteran broadcaster and naturalist
Leonardo DiCaprio -- American actor
This visualization aims to show total energy consumption proportion of top 20 countries which consume low-carbon energy from 2007 to 2016.As developing countries are rapidly industrializing, they have plenty of demand for energy and mainly consume high carbon energy. Developed countries such as Europe, North America are leading the world in low-carbon energy applications and energy transformation.
Over the past years, significant findings regarding global warming highlighted the need to curb carbon emissions. From this, the idea for low-carbon power was born. Internationally, the most prominent early step in the direction of low carbon power was the signing of the Kyoto Protocol, under which most industrialized countries committed to reduce their carbon emissions. (Wikipedia)
Reducing carbon dioxide emissions is an important topic for heated discussions and deliberations. The signing of the Kyoto Protocol has made the most prominent early step in the direction of using low carbon energy to mitigate the problems of climate change. From 2008-2016 low carbon energy like hydropower, geothermal, wind, solar energy have grown considerably.
Low-carbon energy has grown increase rapidly, in the following section, it will be analyzed the efficiency of the low- carbon energy.
From 2000 to 2016, hydro power and nuclear energy accounted for a large proportion of the consumption of low-carbon energy.
"Overnight capital cost is a term used in the power generation industry to describe the cost of building a power plant overnight. It is a measure of a power source which attempts to compare different methods of electricity generation on a consistent basis."(Wikipedia)
For years, many debates on the future of the electricity system centered on getting the balance right between higher costs and lower environmental impacts. However, the price remains too high for the amount of low-carbon energy produced.
 Source:IPCC
This chart shows global nuclear energy consumption from 1965 to 2016. The growth in nuclear consumption is related to nuclear accidents and anti-nuclear movement. World nuclear power generation decreased 0.7% in recently ten years. This is down from 2005, largely as a result of reactors being taken offline post-Fukushima nuclear accident.
Our energy consumption has increased year by year. Mitigating climate change relies on the use of low-carbon energy. Nuclear energy is a non-polluting, long lasting, high output energy source relative to space taken up by the other low carbon energies. However, one of the main disadvantages is the difficulty in the management of nuclear waste and nuclear safety. It needs to spend much time on eliminating the radioactivity and risks. For people, the advantages and disadvantages of nuclear energy is a double-edged sword which has made this energy becoming the most controversial on the market.