Demographics of the Internet
Group 02

(Dis)United Nations of the Internet

Group 02
Cristina Pita da Veiga, Evansha Agrawal,
Guilherme Appolinario, Maria Almeida,
Natalia Malaver, Rebeca Vittorazo

A visualization about the
Demographics of the Internet

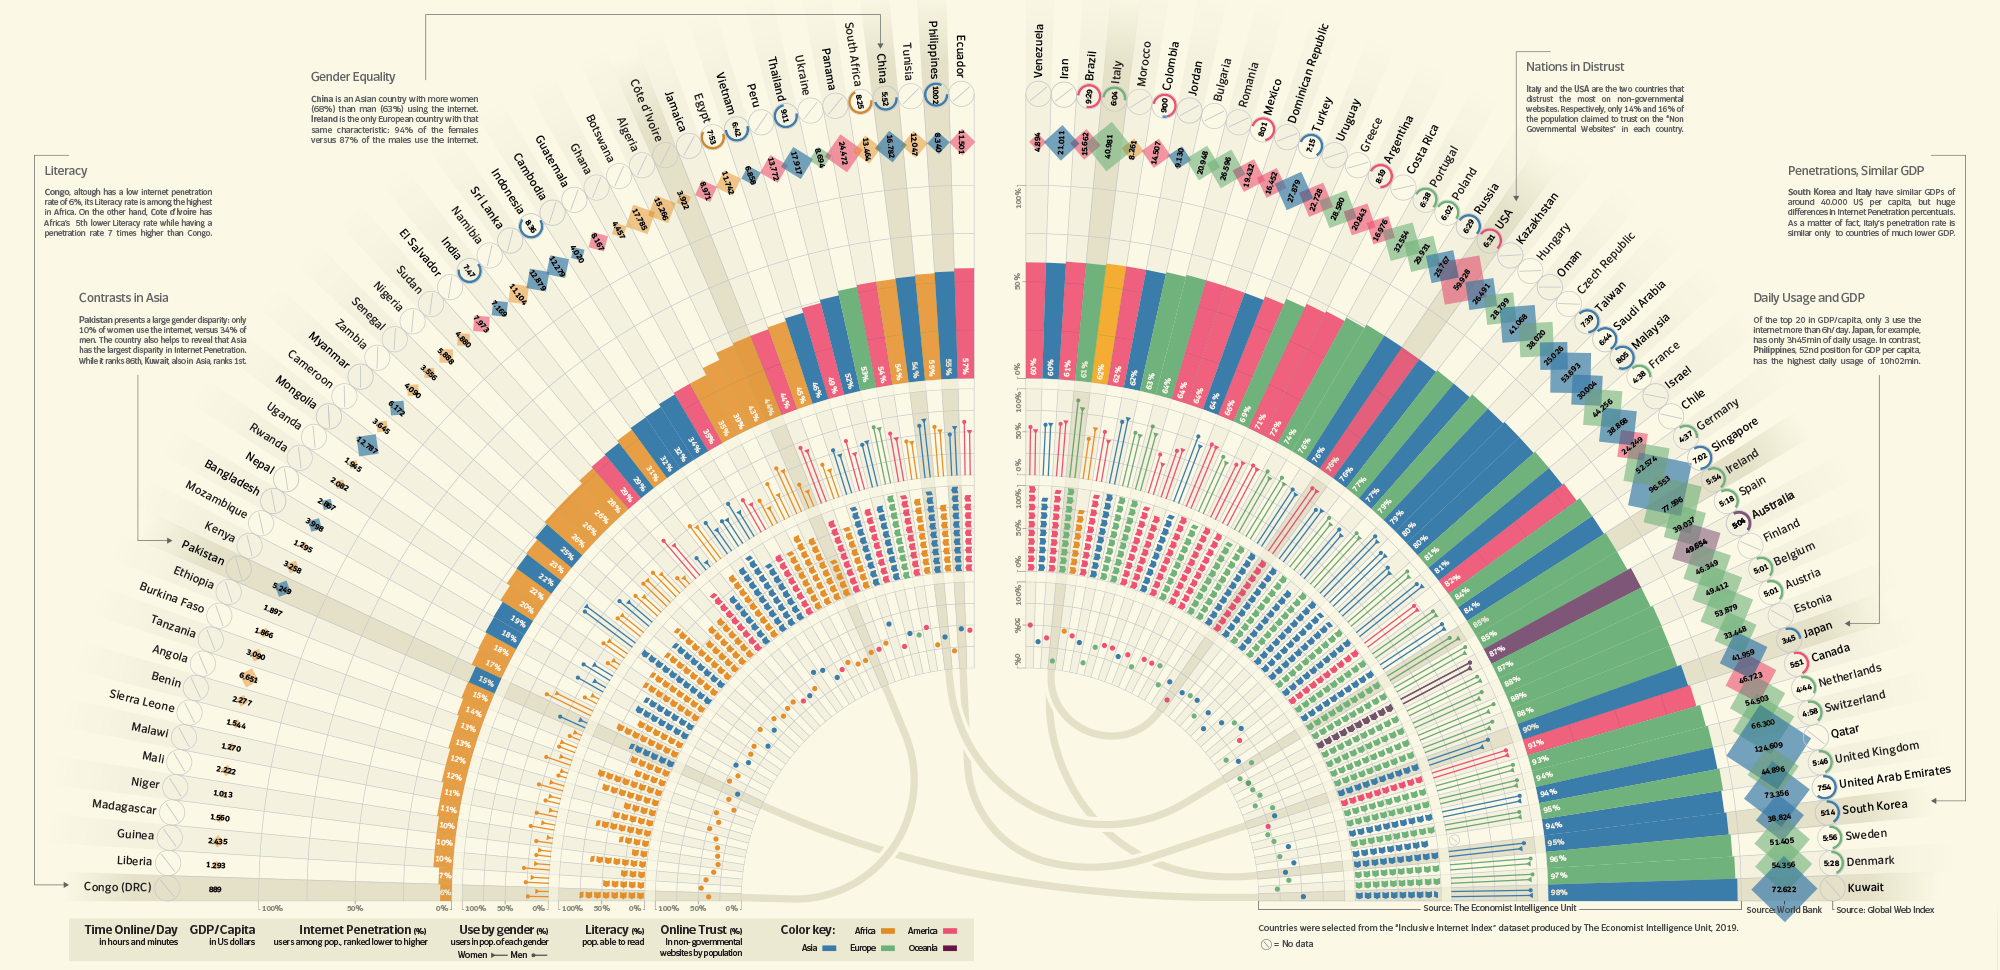
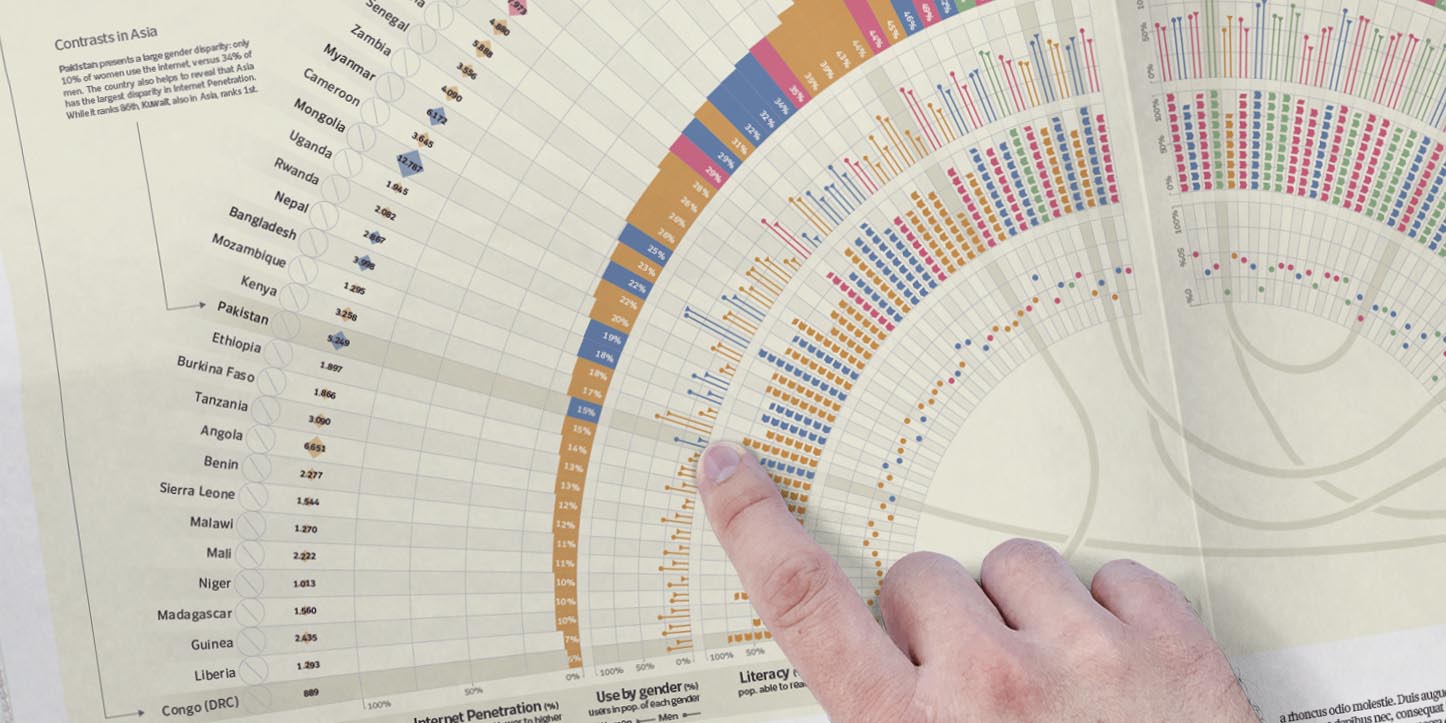
The infographic presents data about 100 countries, providing an overview of the Internet penetration in each territory. Alongside Internet penetration, interesting topics such as: literacy; gender disparity; time spent online; trust on non-governmental websites and GDP per capita are also depicted. These data helps to portray today’s society and their correlations may surprise the viewers.

The goal of the graph is to present an easy reading of a large amount of data, guiding and encouraging viewers to analyse and compare continents, countries and other different data variables.

The visualization was designed for a print newspaper and it empowers readers in finding answers to questions such as:

  • Is internet inclusive worldwide?
  • Does GDP affect the penetration level of Internet?
  • Is internet equally accessed by males and females?
  • Does literacy level affect internet consumption patterns?
The arc coverage on the newspaper page was one of the reasons why that format was chosen.

The process

How we arrived here and what we want to show

Datasets

Our main datasets for this infographic were taken from a series of researches made by The Economist Intelligence Unit and complemented with data from the Global Web Index and the World Bank, being the last one dedicated to the economic side of demographics. There were, in the end, 6 datasets to be visually represented and we chose Internet Penetration as the main one from were comparisons should arise.

Visual Representation

Many ways of portraying that data were experimented. A multi-track arc was the chosen option due to its good coverage of the newspaper space and the possibility to simultaneously present multiple variables by country. The visual appeal of the shape also comes from its resemblance to the concept of a parliament, reinforcing the idea of a world divided by countries, as is the parliament of the United Nations.
Displaying countries together allows for an overview of how the Demographics of the Internet. At first glance, an ascending "ramp" of the Internet Penetration level is seen. From there, one can dive deeper into the other variables for each country.

A few of the sketches tried out during the process.

How to read
Into the details

Representing Values

  • Time Spent Online: clock-like graphs;
  • GDP/capita: rhombuses varying area;
  • Internet Penetration: % with bars;
  • Gender: % lines with circle-ends for men and triangles for women;
  • Literacy: % bar graph made of books;
  • Trust in Non-Governmental Websites: circles varying positions according to %.

Colors

Continents have different color hues, that vary in saturation and luminosity among each group of data displayed.

Reading and Comparing

The graph can be read left to right, following Internet Penetration growth.
Or from the country name outside to inside, where countries values are.

To enhance comparability, multi-country notes with interesting findings were added, with the countries being linked by lines travelling throughout the arc.

Interesting Findings
Highlights that aid comparison

Internet Penetration

Internet Penetration grows with GDP, but some countries are exceptions to this.


  • Asia (from Pakistan to Kuwait) has countries in most GDP and Penetration ranges.

  • Lastly, high values on Time spent Online are usually from countries with low GDP and Penetration, such as Brazil and the Philippines.

Gender

It’s interesting to show that African states show higher percentages of men using the internet, while Europe presents a more balanced yet still unequal view.


  • In the Philippines, a country with low penetration rates and GDP/capita, women use the Internet more than men. Meanwhile, in Europe, the continent with the highest GDPs per capita, only Ireland has more women than men using the Internet.

Literacy and Trust

We can also find contrasts relating the Literacy of the total population (%) with the Trust in Non-governmental Websites. Generally, countries with less literacy rates trust more in non-governmental websites than those with higher literacy rates.


  • One notable exception is Pakistan, with low literacy levels compared to other Asian countries but yet also very little Trust levels on Non-governmental websites. Another exception, though on the other side of the coin, is the Philippines: high literacy leves and high levels of trust.

Detail view of the interaction with interesting findings

Datasets and Links

Final Dataset
Collected and refined
Internet Penetration, literacy, gender and trust
The Economist
Time spend online
Global Web Index
GDP per capita
World Bank
Final Infographic
PDF file