The Physical
Internet
Group 04
Beatrice Bazzan, Allegra Colombo,
Martina Giordano, Gianluca Misto,
Ludovica Piro, Irina Stojsic
The Physical Internet
Group 04
The Physical
Internet
Group 04
Beatrice Bazzan, Allegra Colombo,
Martina Giordano, Gianluca Misto,
Ludovica Piro, Irina Stojsic
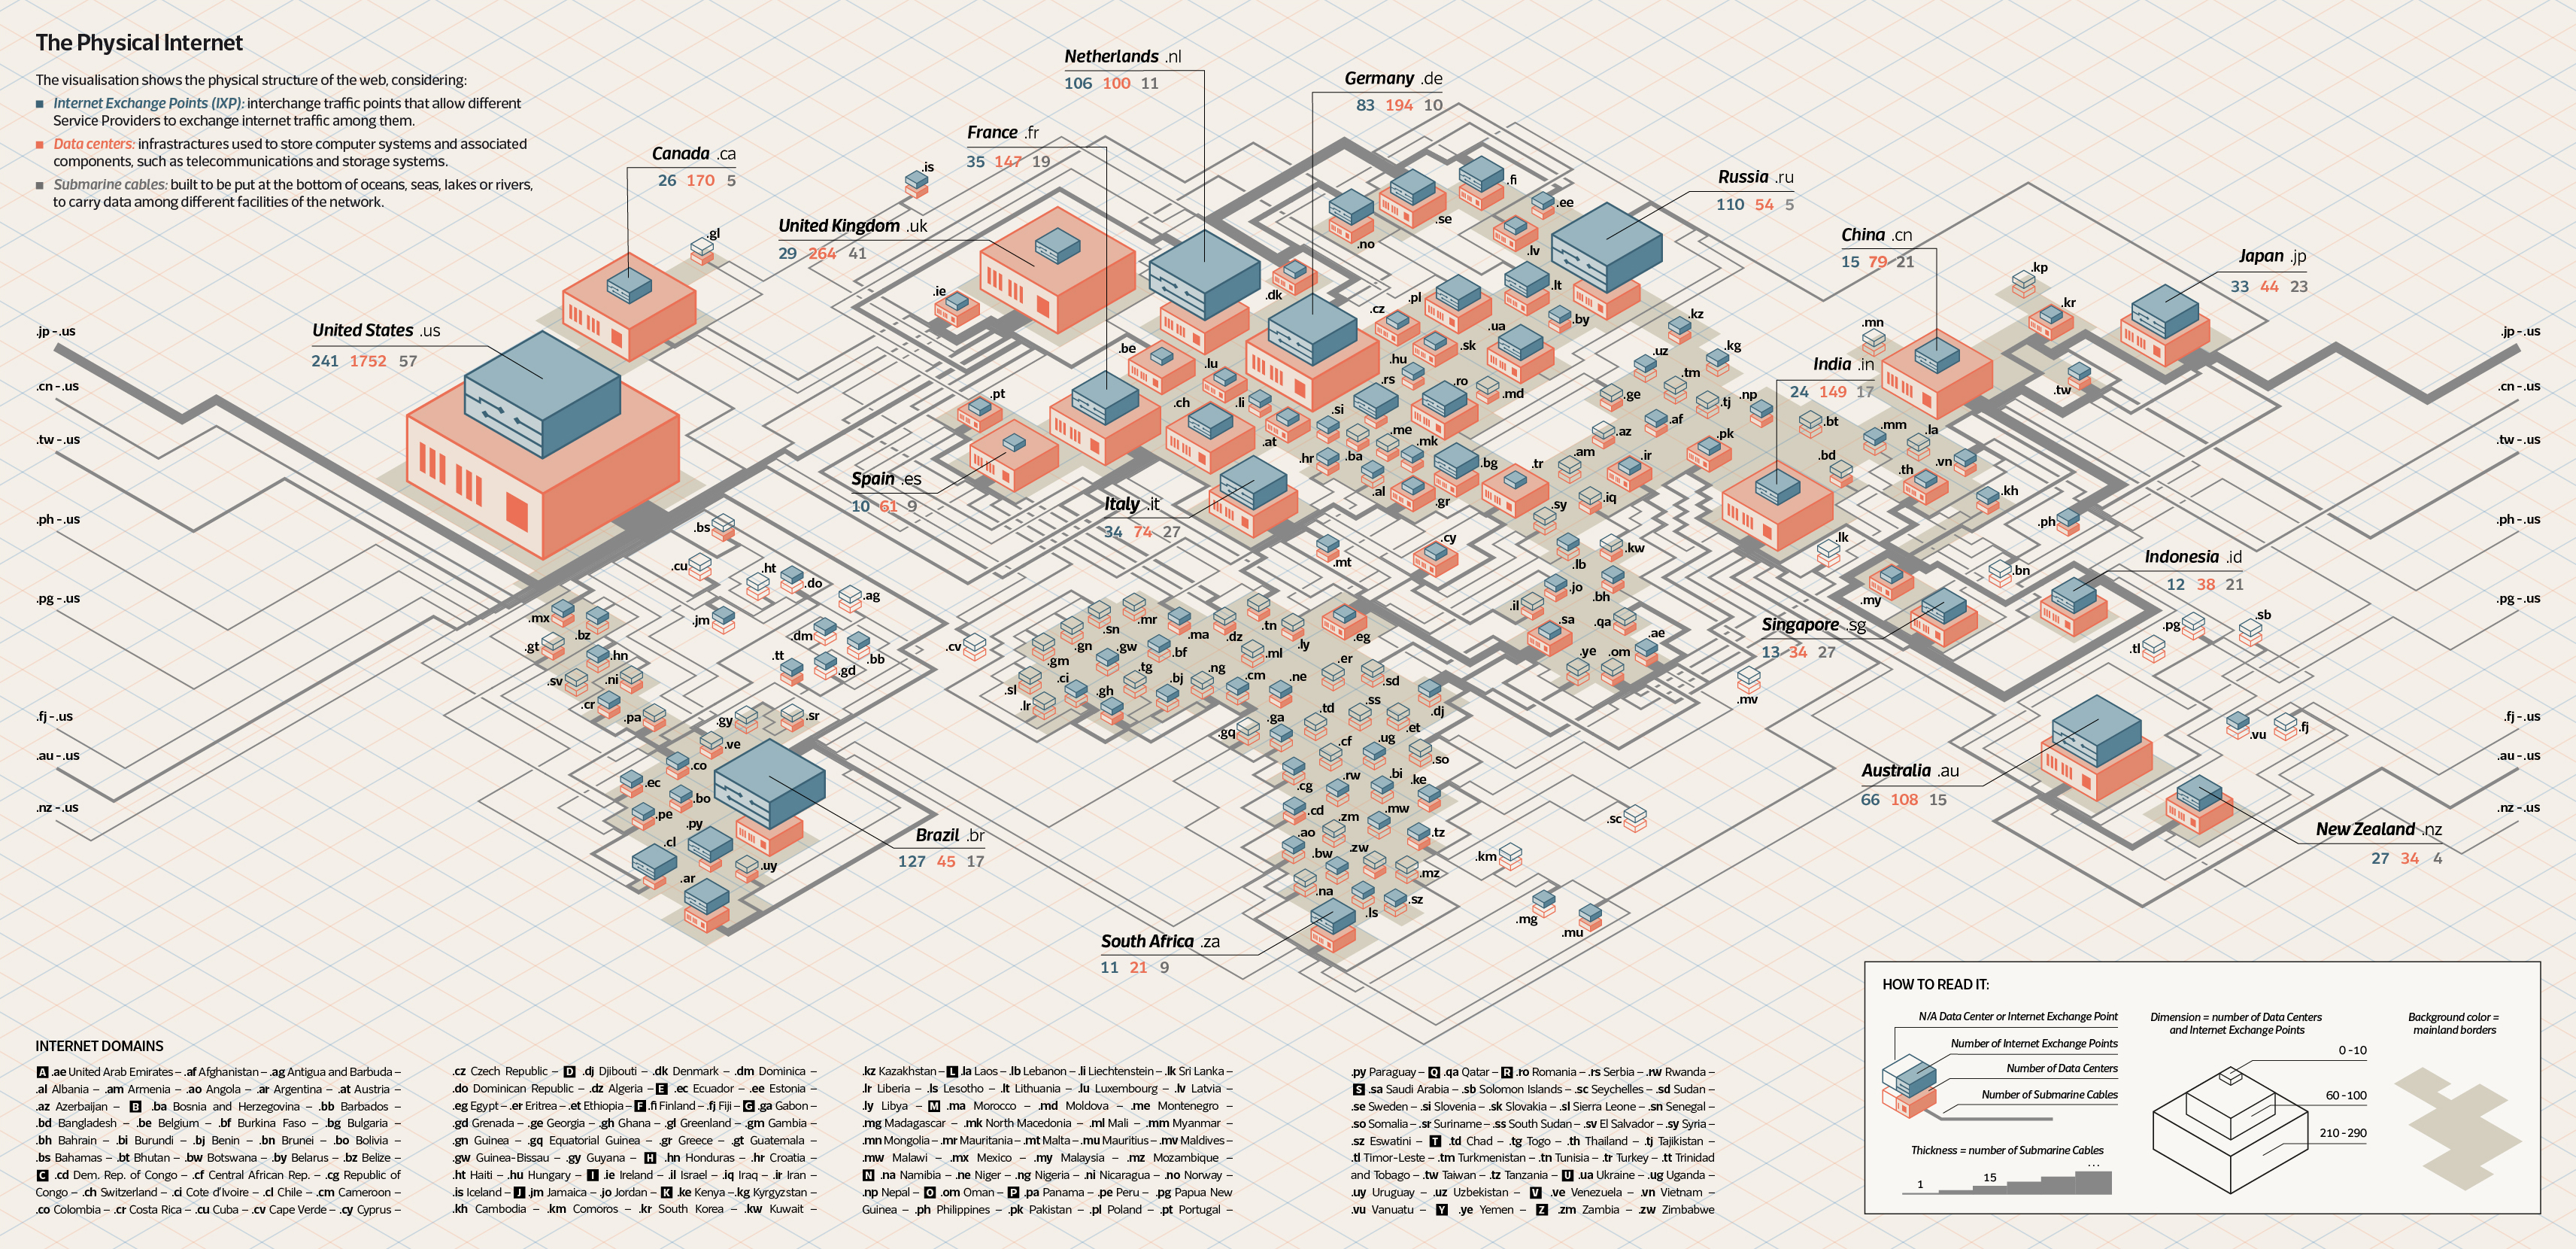
Physical Internet is not something on the cloud, but rather a structure made of physical objects:
routers, cables, antennas, internet exchange points and data centers are just some of the elements that make this communication possible. The visualization focuses on showing the physical structure and the actual number of three main objects: data centers, where data is organized and stored; internet exchange points, that allow different service providers to exchange internet traffic; and, submarine cables, that carry telecommunication signals across oceans and seas.
By looking at the visualization, one can easily see the difference between the countries who are connected and the ones which are being left out.
For example, the United States of America have the greatest number of internet exchange points, data centers and submarine cables, which makes them the most connected country in the world. The visualization was produced using a quantitative approach for analyzing the data.
As one of the communication goals was to represent the physicality of the Internet, the various elements of the infrastructure are represented as 3D objects.
It was fundamental to create a map in order to have, not only an overall view of the infrastructures, but also to see the connections between continents and countries.
Naturally, this is translated into a cartogram which allows to present all the data that has been collected: numbers and locations of infrastructures and connections. Every country is placed in a right geolocation, making the visualization more accurate to the world map. Moreover, continents are differentiated from the oceans using a different colour.
Colors and visual style
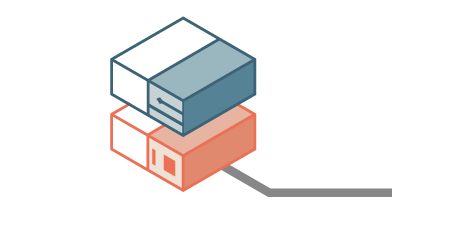
The object of two rectangles represent the number of infrastructures in a country. The blue one, on the top, is indicating the number of IXPs, i.e. internet exchange points, while the orange one is indicating the number of Data Centers. When there is not any IXPs or Data Centers in a country the objects are shown with the outline.
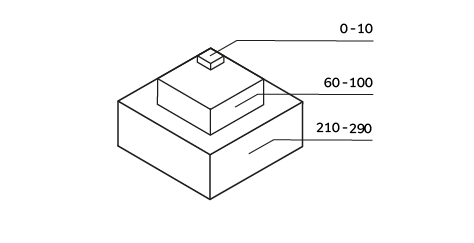
Dimensions of Data Centers and IXP
The dimensions are scaled in a range of seven different sizes, each one proportional to a different amount of IXPs and data centers. Only the United States are represented out of scale with a dimension proportional to its number of Data Centers (1752) and IXPs (241). In the legend there are just three dimensions (lowest, middle and the highest values) for clarity reasons.
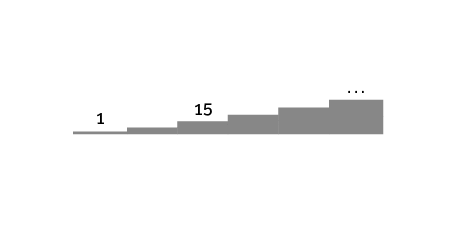
Thickness of the lines
The cables are drawn as lines, whose thickness is proportional to the real number of cables. The countries which are connected with just one submarine cable are presented with the thinnest line while the country with the biggest number (USA – 54 submarine cables) is presented with the thickest line.
Background color
In the background map of the continents are differentiated from the oceans using a darker hue
of the visualization base colour.

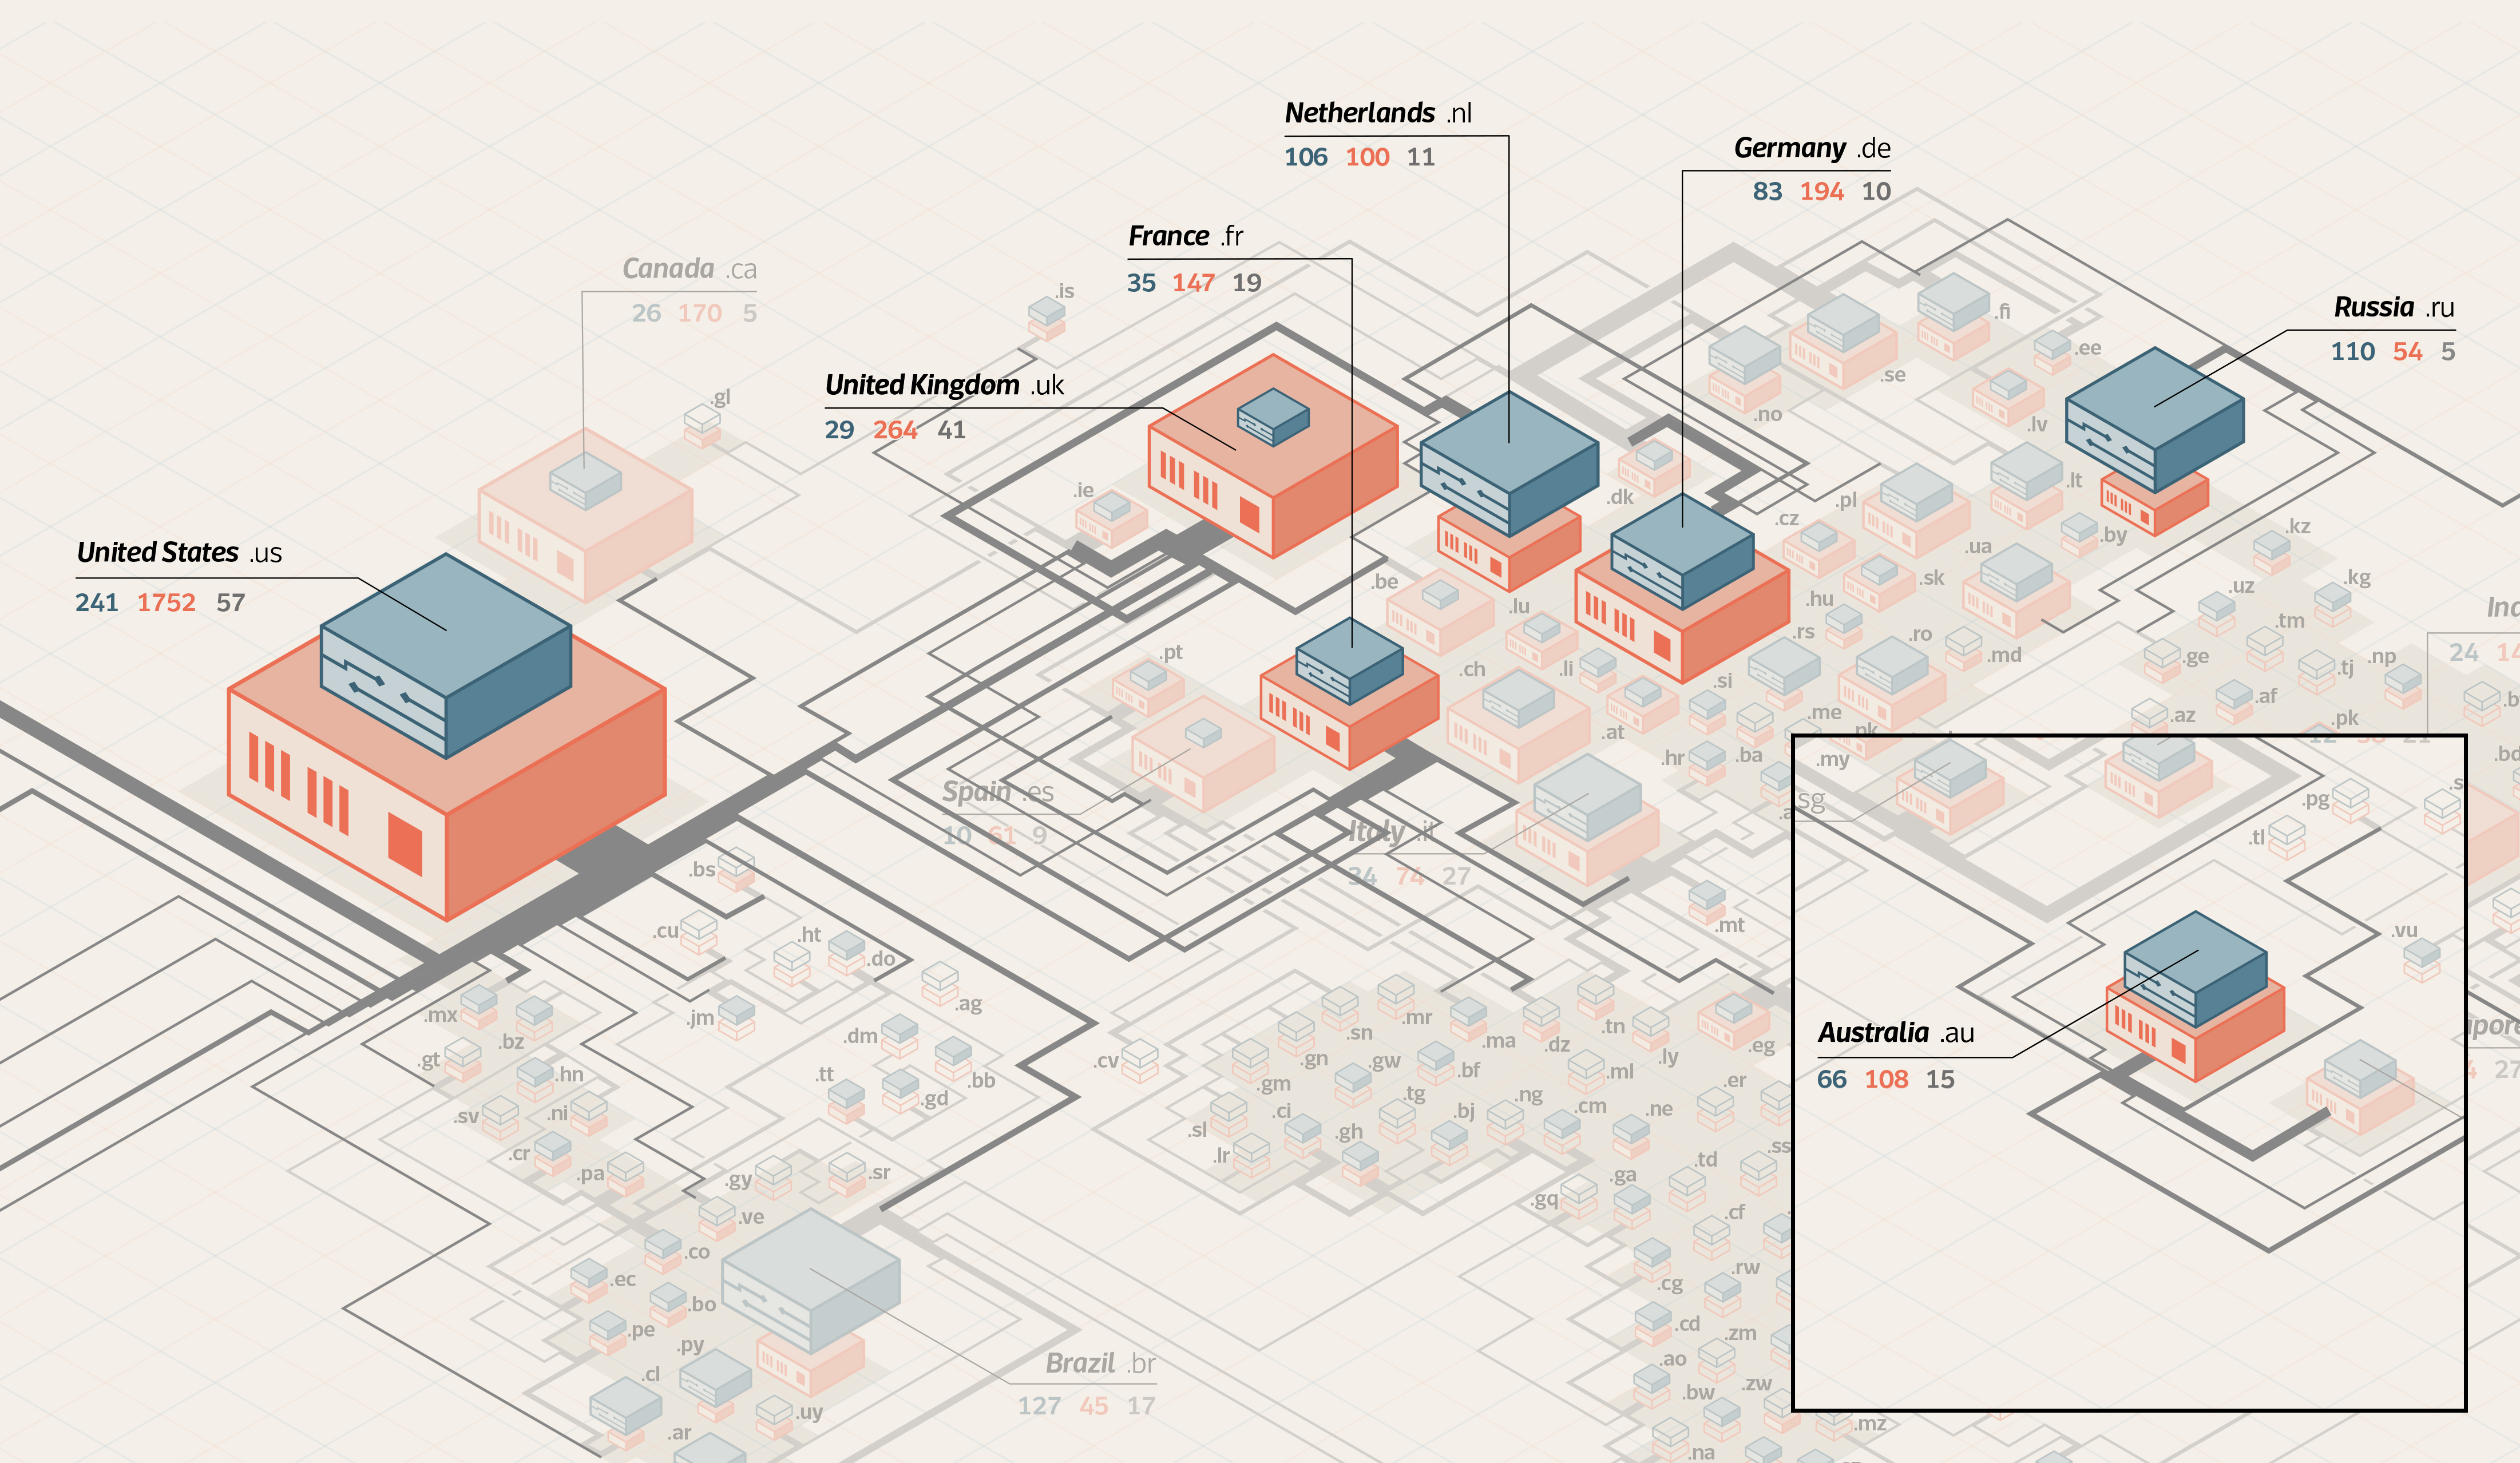
This type of visualization is also useful to understand political and economic situations. It is already familiar that the northern part of the world globe is more developed than the southern part. The difference is also present when it comes to the Internet access. By looking at the visualization, someone can immediately identify the most connected countries, which are also the most influential ones, like the United States of America, which was the first country with the best access to the Internet's resources for several years, then The United Kingdom, France, The Netherlands, Germany, Russia and Australia.
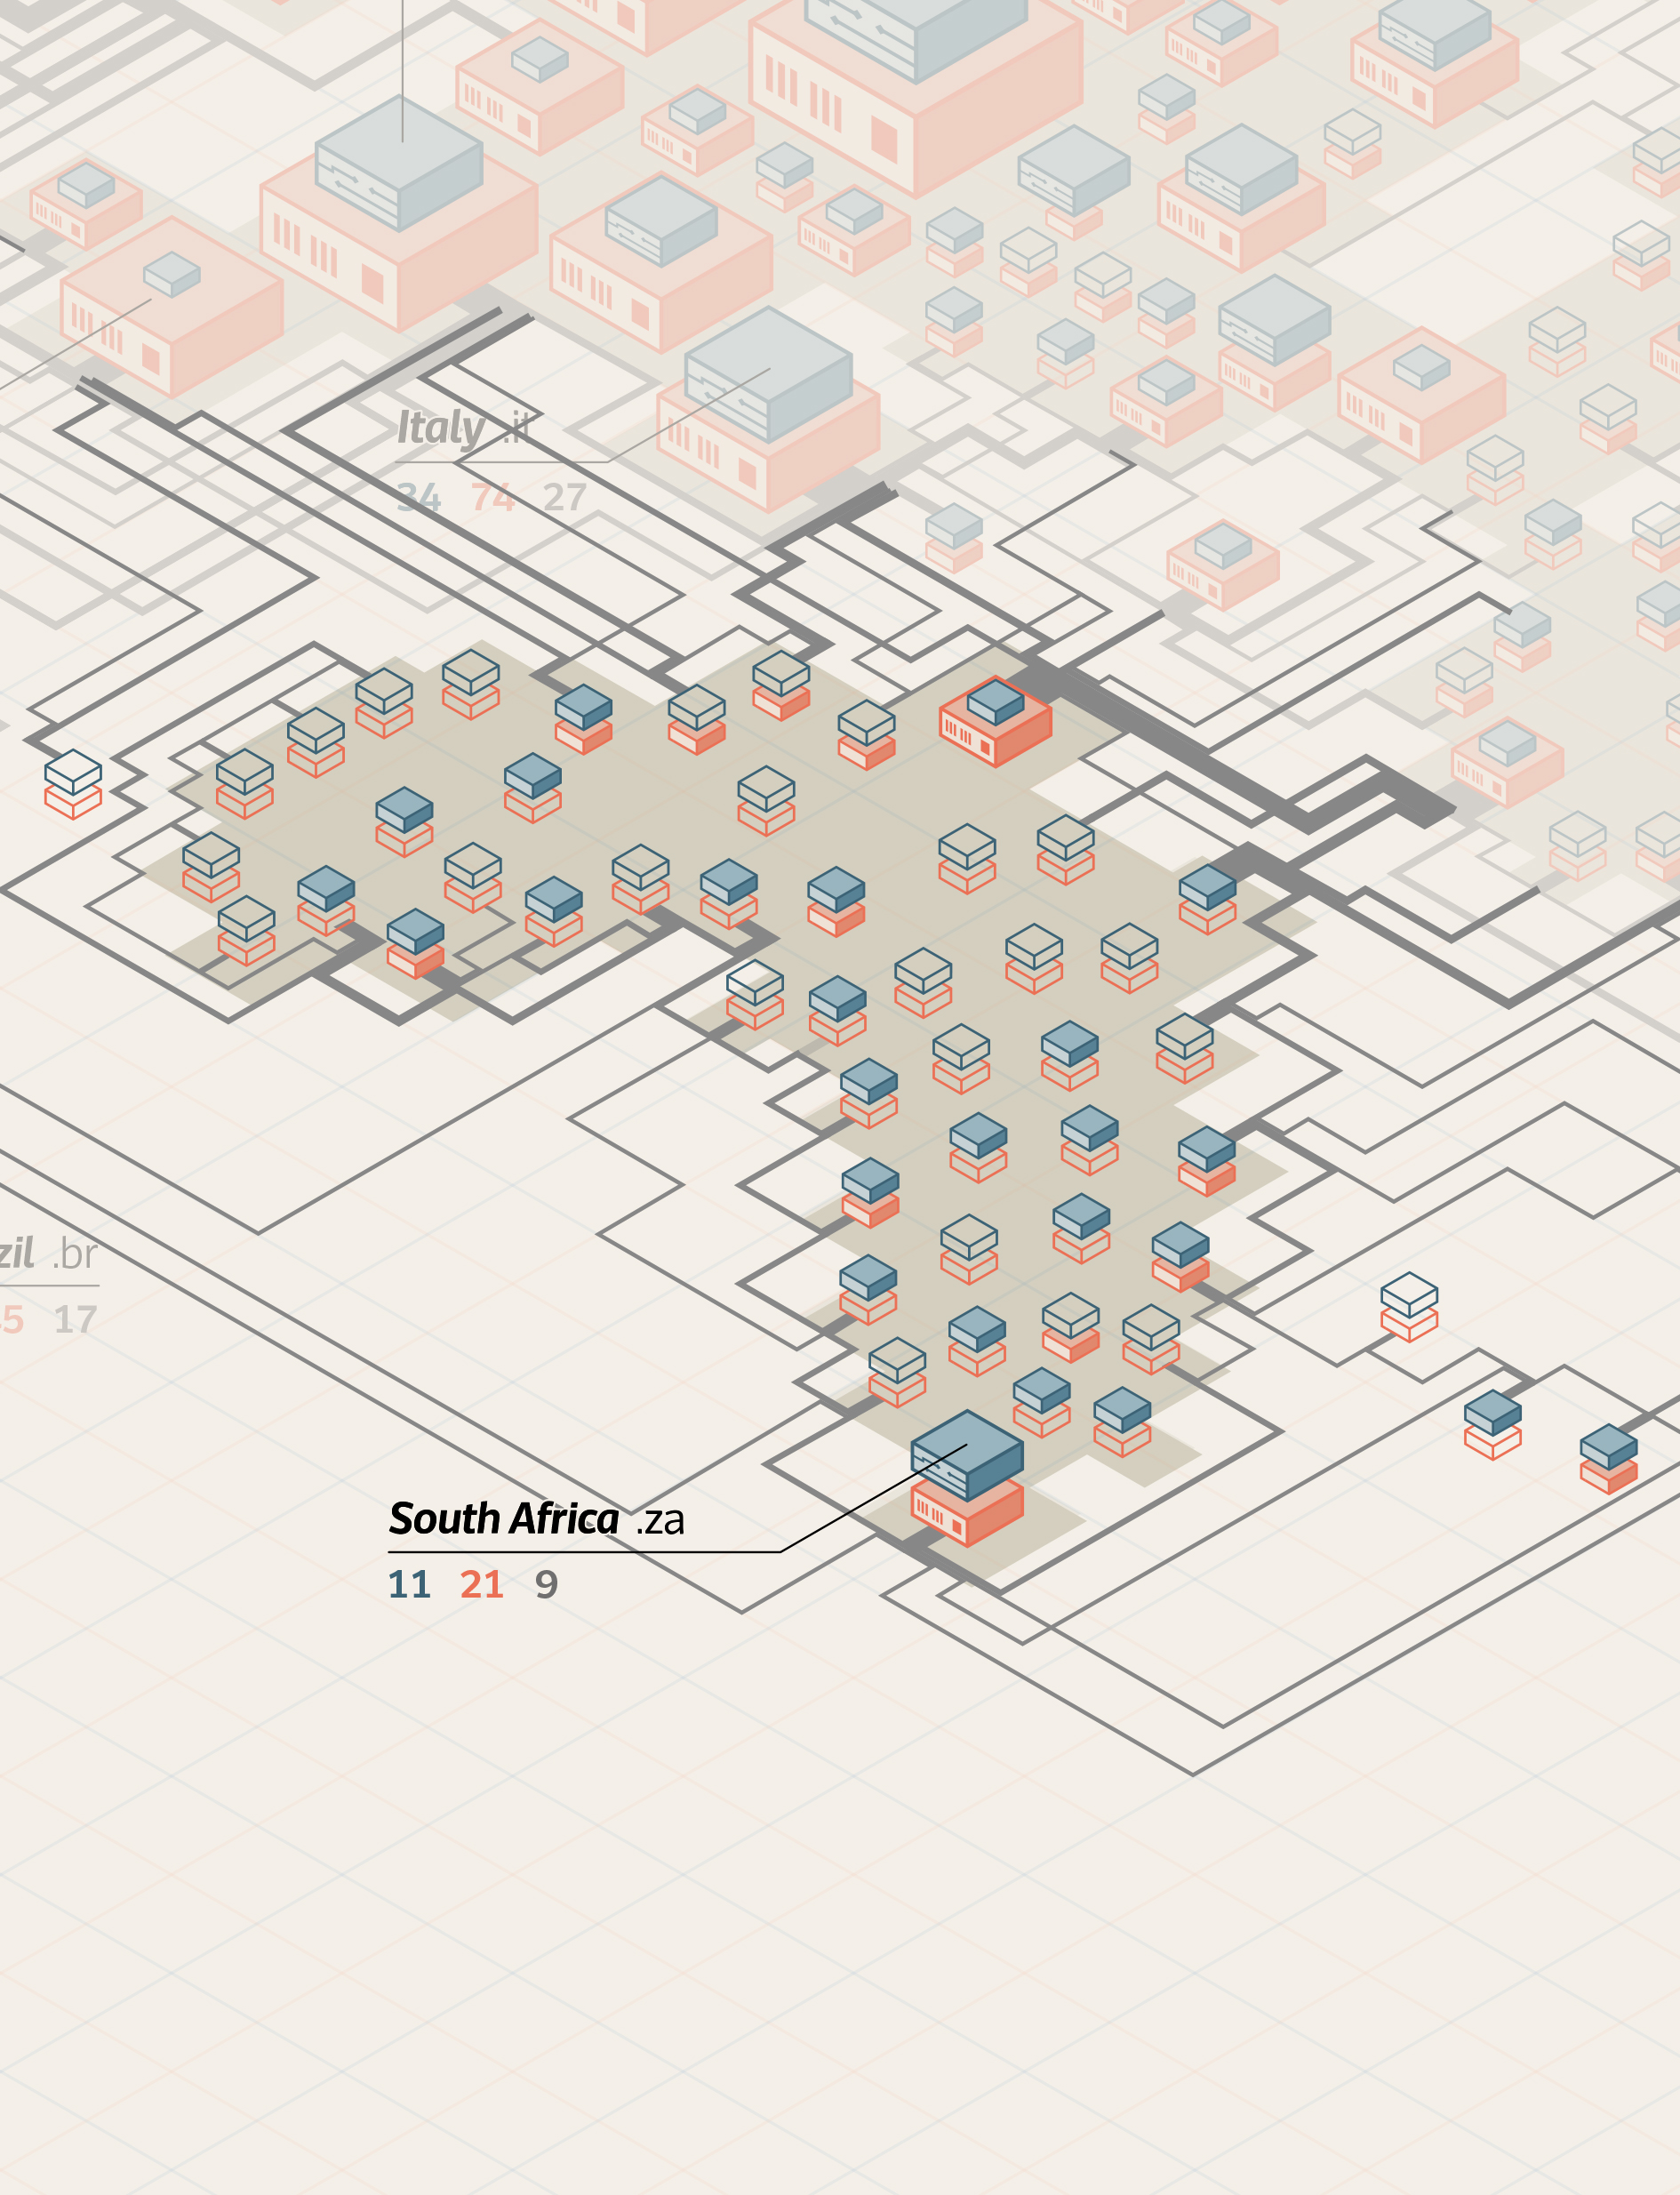
The continent which stands out the most, by not having IXPs and data centers is Africa. The greatest number of IXP usually is in countries with advanced economies and established internet infrastructures. Because of this, 42 percent of African countries are without a hub, meaning their internet traffic is being routed across borders and even oceans resulting in poor local connections. Facebook and Google are rushing to build IXP, in order to respond to the growing demand in Africa.
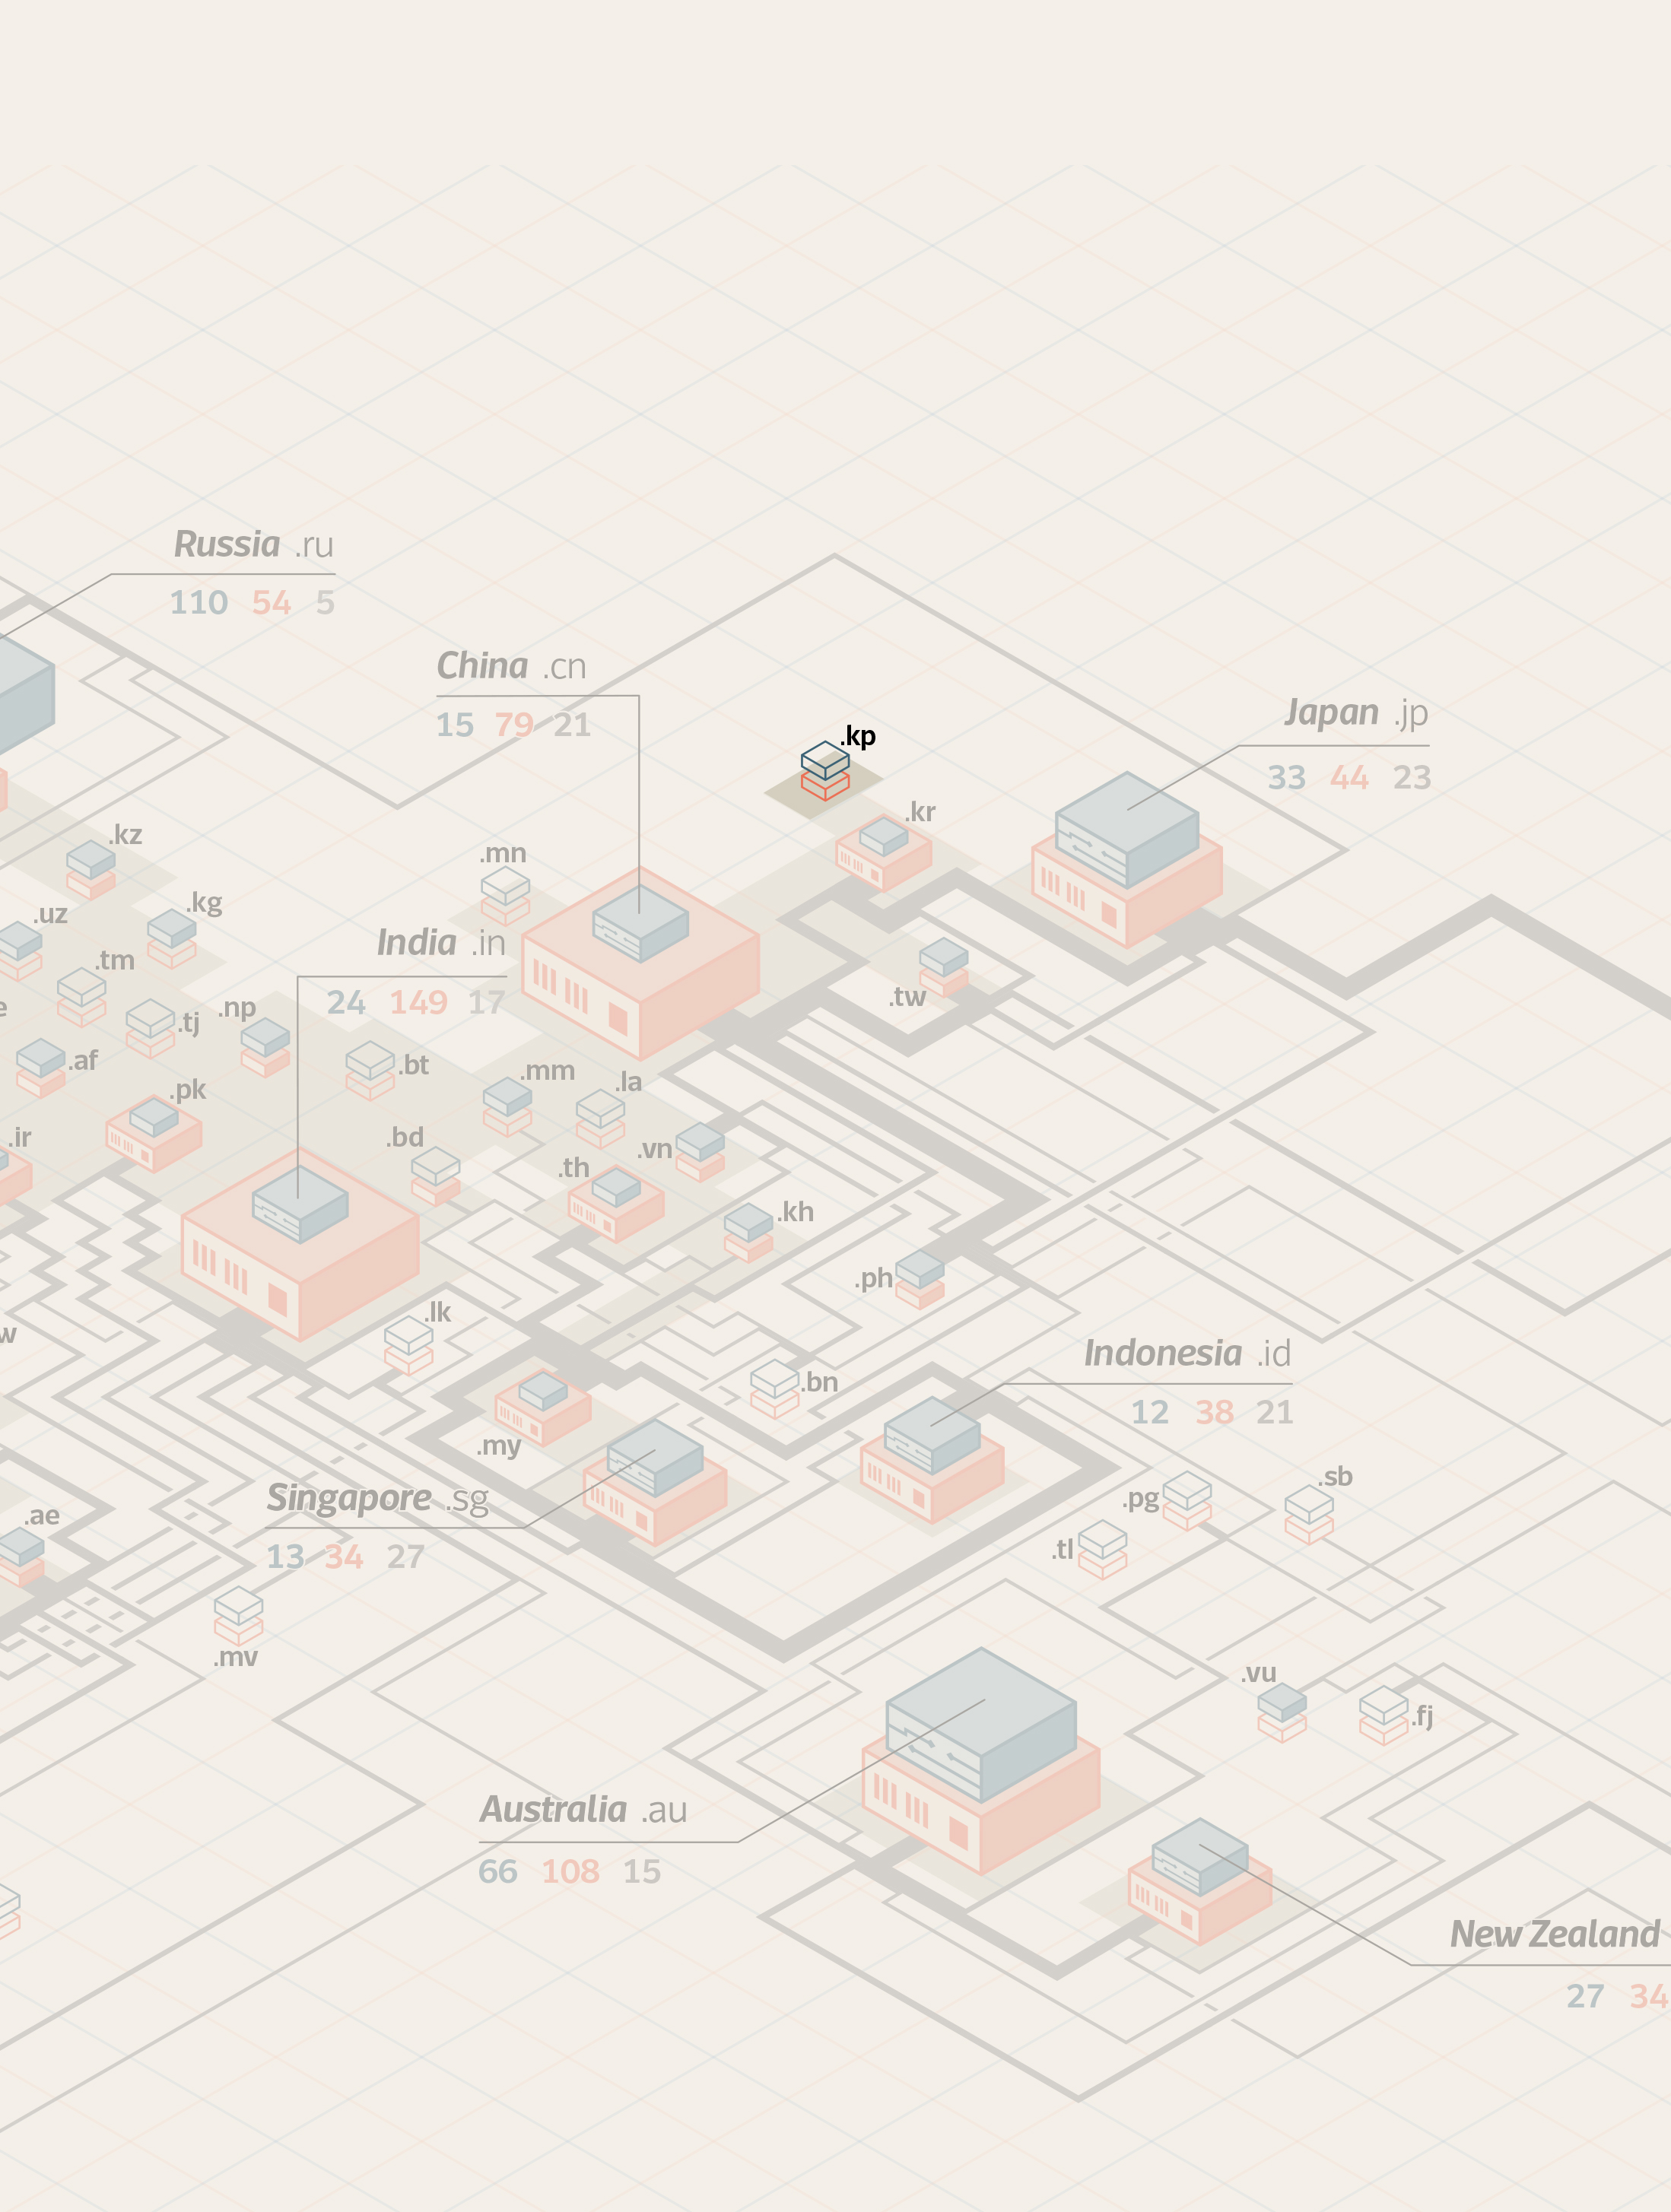
Another particular case is North Korea, for which there is no information about IXPs and Data Centers. Internet censorship is still very strong and full use of the global Internet is available to only a small handful of high-level officials in the Workers’ Party of Korea.