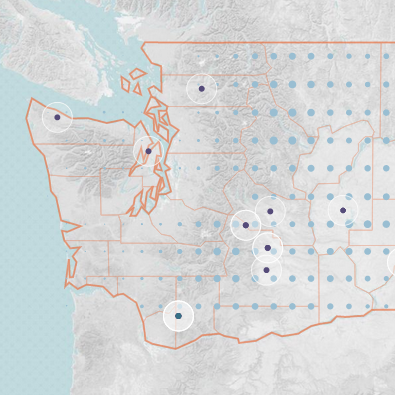
Weather on the west coast has radically different densities and patterns.
This heat-map gives a comprehensive view of all states trends through
the considered time span.*
Some typical climate effects, such as the the rain shadow effect on the Cascade Ranges or the precipitation frequency gap between the northern and southern California, are clearly visible.

WASHINGTON
data points: 216

Max. 56.257 in → Lat 47°61' N / Lon -123°43' W
Min. 5.44 in → Lat 46°67' N / Lon -120° W

OREGON
data points: 263

Max. 41.774 in → Lat 45°42' N / Lon -123°43' W
Min. 5.933 in → Lat 42°61' N / Lon -117°5' W

CALIFORNIA
data points: 423

Max. 37.733 in → Lat 41°99' N / Lon -124°06' W
Min. 1.196 in → Lat 32°93' N / Lon -115°62' W

Size and color intensity of each data-point on the map represents the total amount of rain in that point for10 years. All values are normalized from 0 to 1.
* Missing data on empty stripes.

Min Max Inches