When an event becomes THE event

How did these events evolve in time on the web?

Introduction

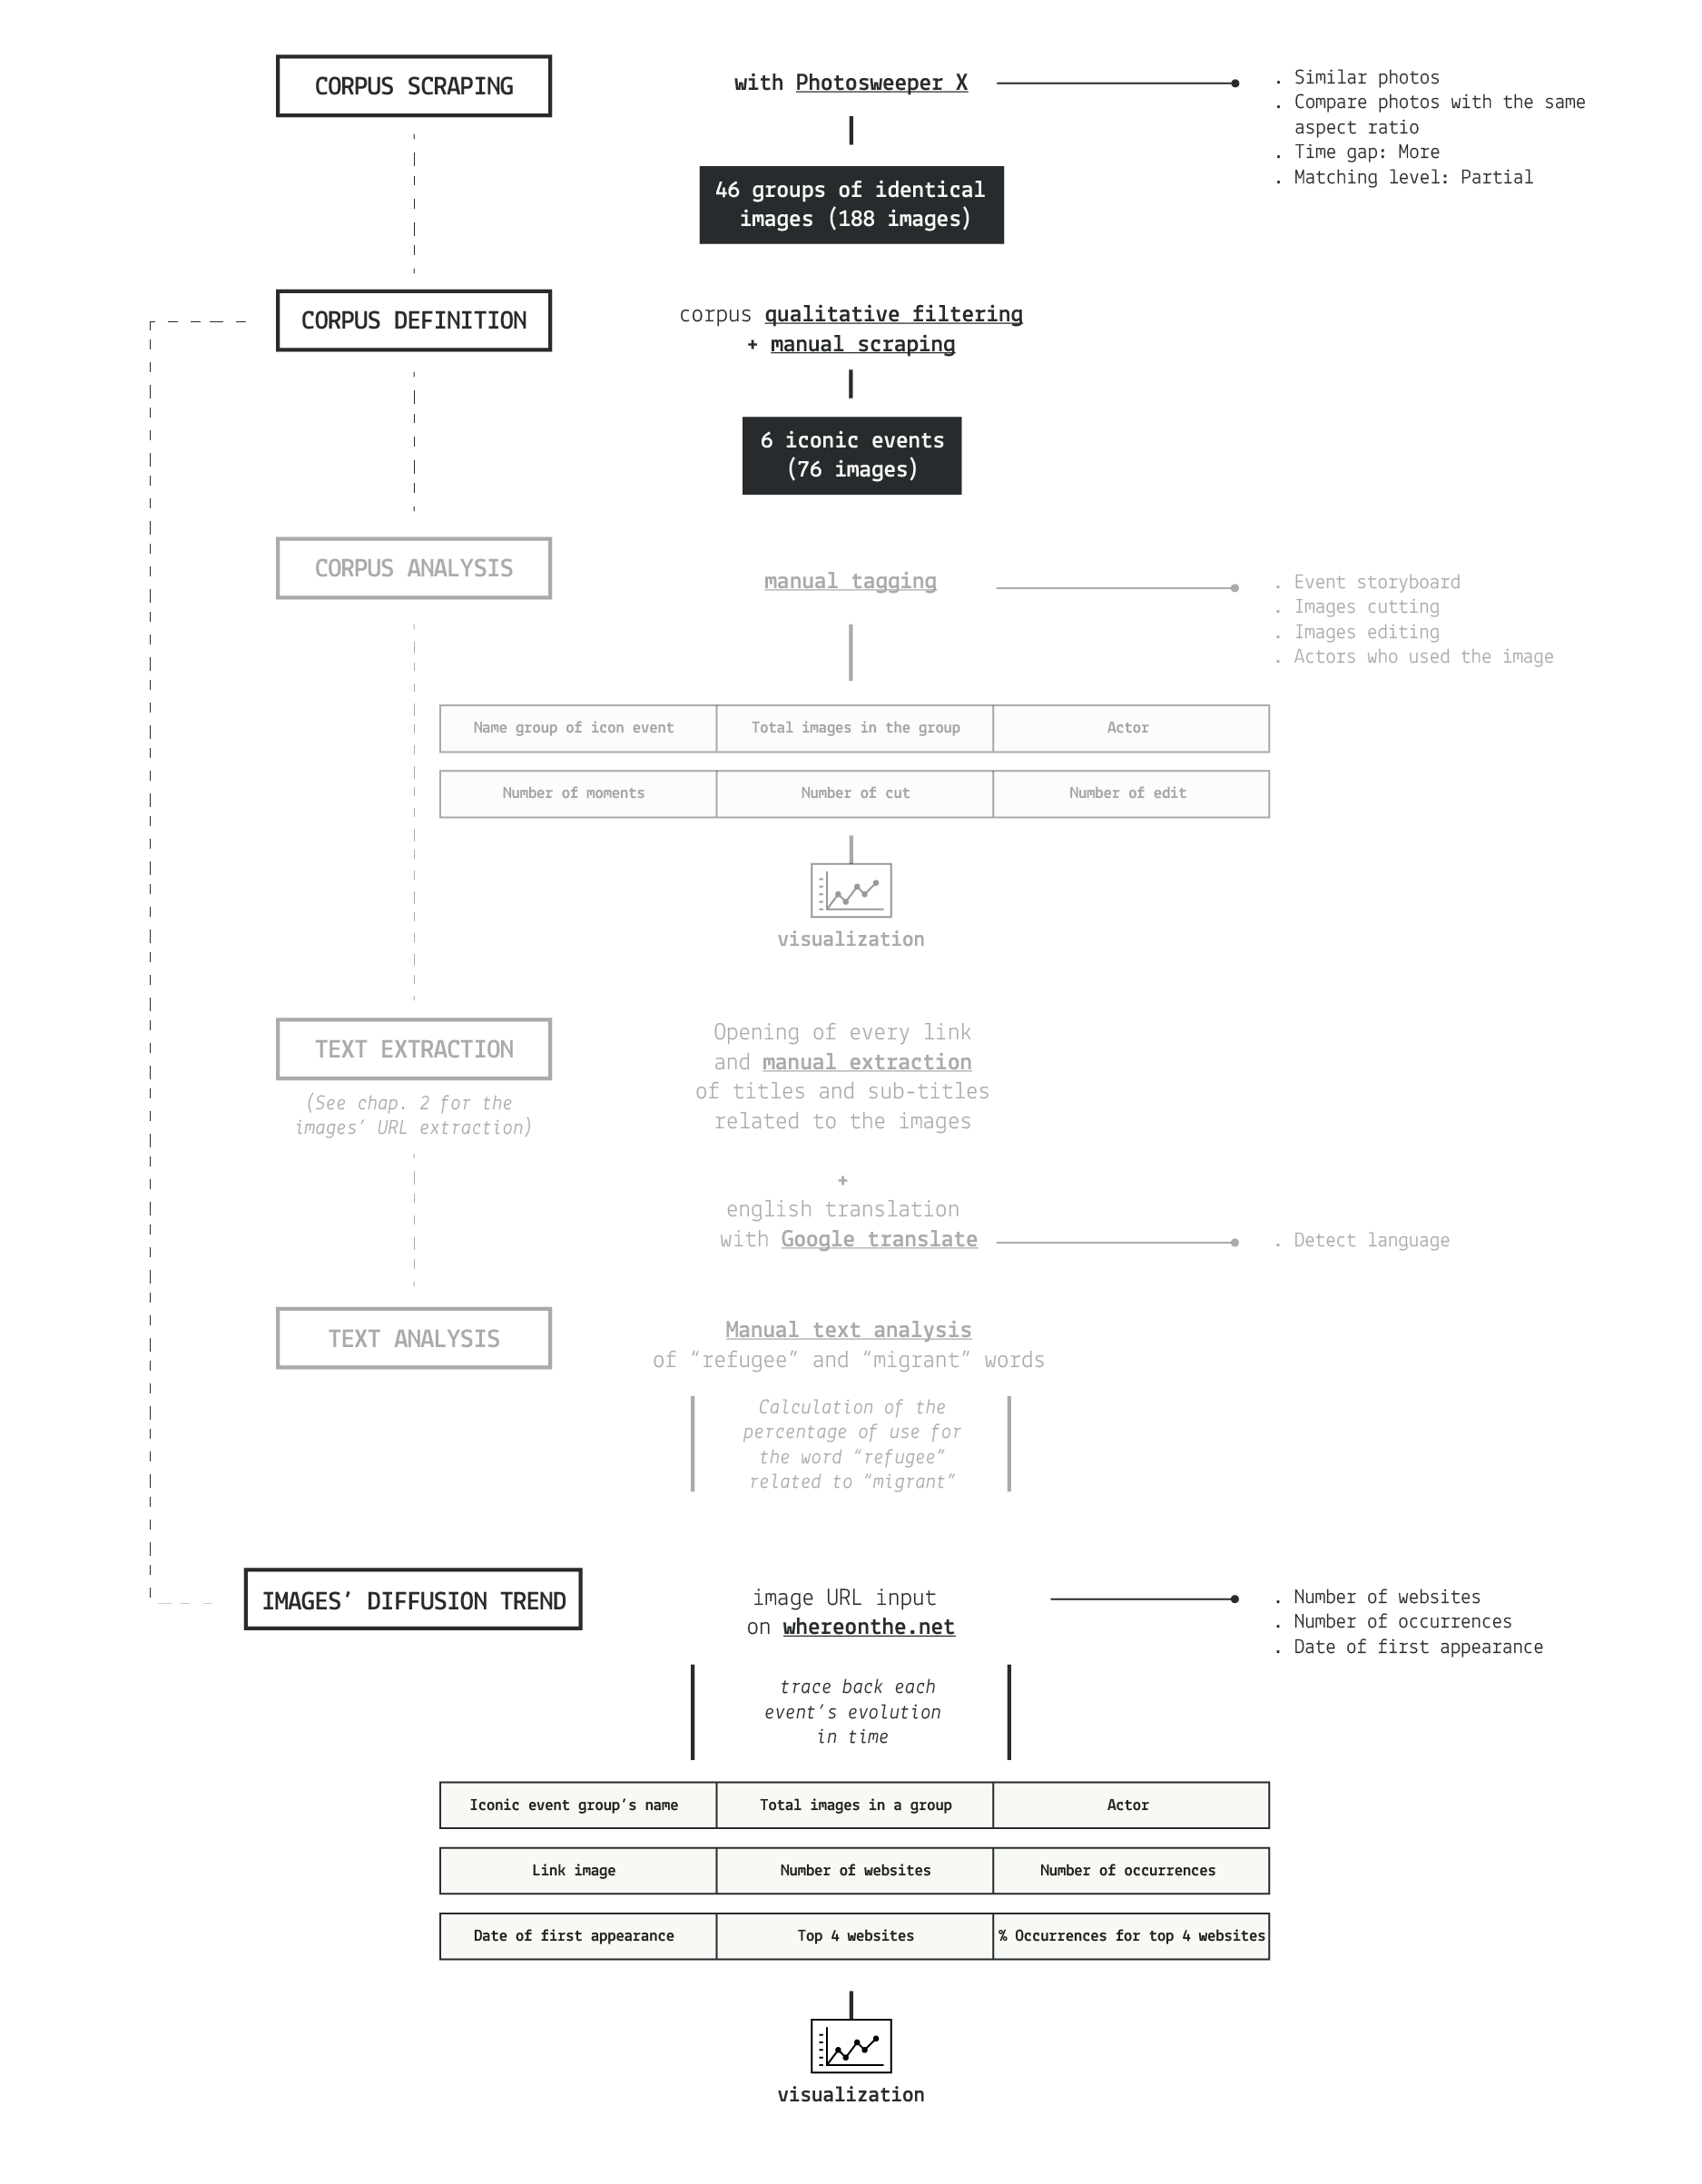
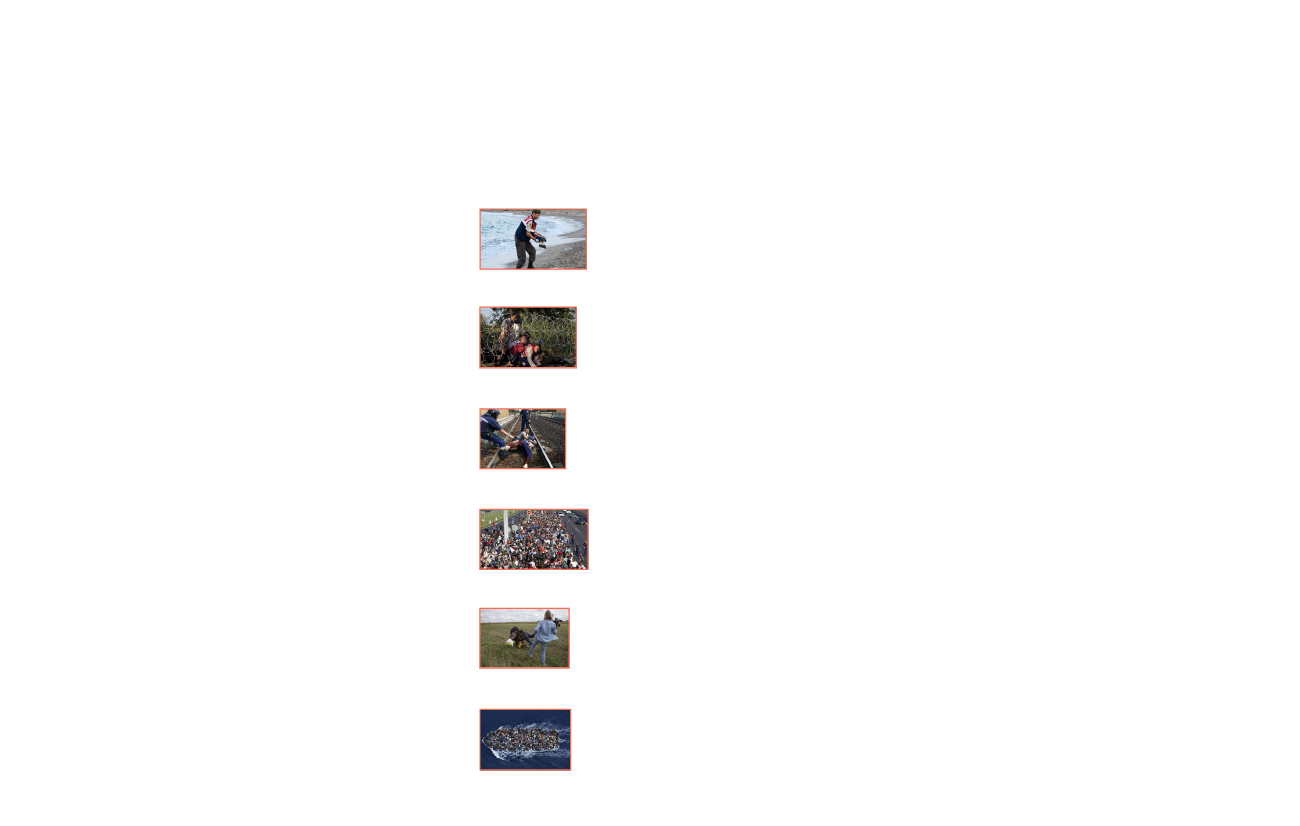
Defined the iconic events, we wanted to see how they evolved online. It was possible to see this thanks to a tool provided by whereonthe.net which, starting from the image’s link, allows to trace back the number of sites using that image and to follow its trend on the web right from its first appearance. By occurrences we mean single pages in which the image appears. Once we traced all of the 76 images obtained from the iconic events, we selected for each of them the most relevant picture based on the volume of occurrences. Their development through time could reveal to us key moments of the debate.

Protocol

How to read it

The visualization shows for each row an iconic event and its trend online since the first time the image appears in percentage. On the left the user can see the total number of sites where the images related to a given event appeared. The bar is composed by 2 colors, orange indicates the use of the most relevant image (which is the one that appears in the chart) based on the n° of occurrences counted by the tool, while yellow shows the volume of the other images of the same event.

Findings

Almost every event concentrates in the late summer of 2015, concurrently to the peak previously found with Google Trends using general queries. On the other hand the use of the picture with the big boat, took by the Italian photoreporter Massimo Sestini on June 7th 2014, skyrocketed only a year later to represent the growing number of migrants arriving to Italy and Greece. In addition, looking at the number of sites where the iconic events appeared, we observed that the picture referring to Alan Kurdi has the highest number of sites, confirming the relevance of this event.

Data

Timestamp: 02/12/2015 - 07/12/2015

Data source: Google Images, Alexa, Whereonthenet

Download data (136KB)