Description
Researchers claim that users belonging to different communities tend not to interact and risk to be only connected with “like-minded” friends. This situation generates closed, non-interacting communities, centered around common narratives and beliefs vehiculated by influencers — this is what the researchers called echo chambers. Confirmation bias accounted for users’ decisions to share certain content, creating informational cascades within their communities. (Washington Post, July 2016). Communities often prefer narratives and reject information that undermine it so the outcome can be a strong flattening of a complex figure or phenomenon. Sometimes even when truthful information are introduced in tribes and communities, they are ignored or used to reinforce users’ false beliefs. According to this point of view, we have some elements that can be used to analyze some particular aspects and factors that occurs in echo chamber and inside digital tribes. For example a sectorial and restricted vocabulary, the repetition of the same thematics, the assumption of few precise terms or even some manner of writing tend to reveal form of homogenization and risk to assume a fragmental imagery of migrants like us-vs-them mentality or indiscriminate optimism regarding the phenomenon.
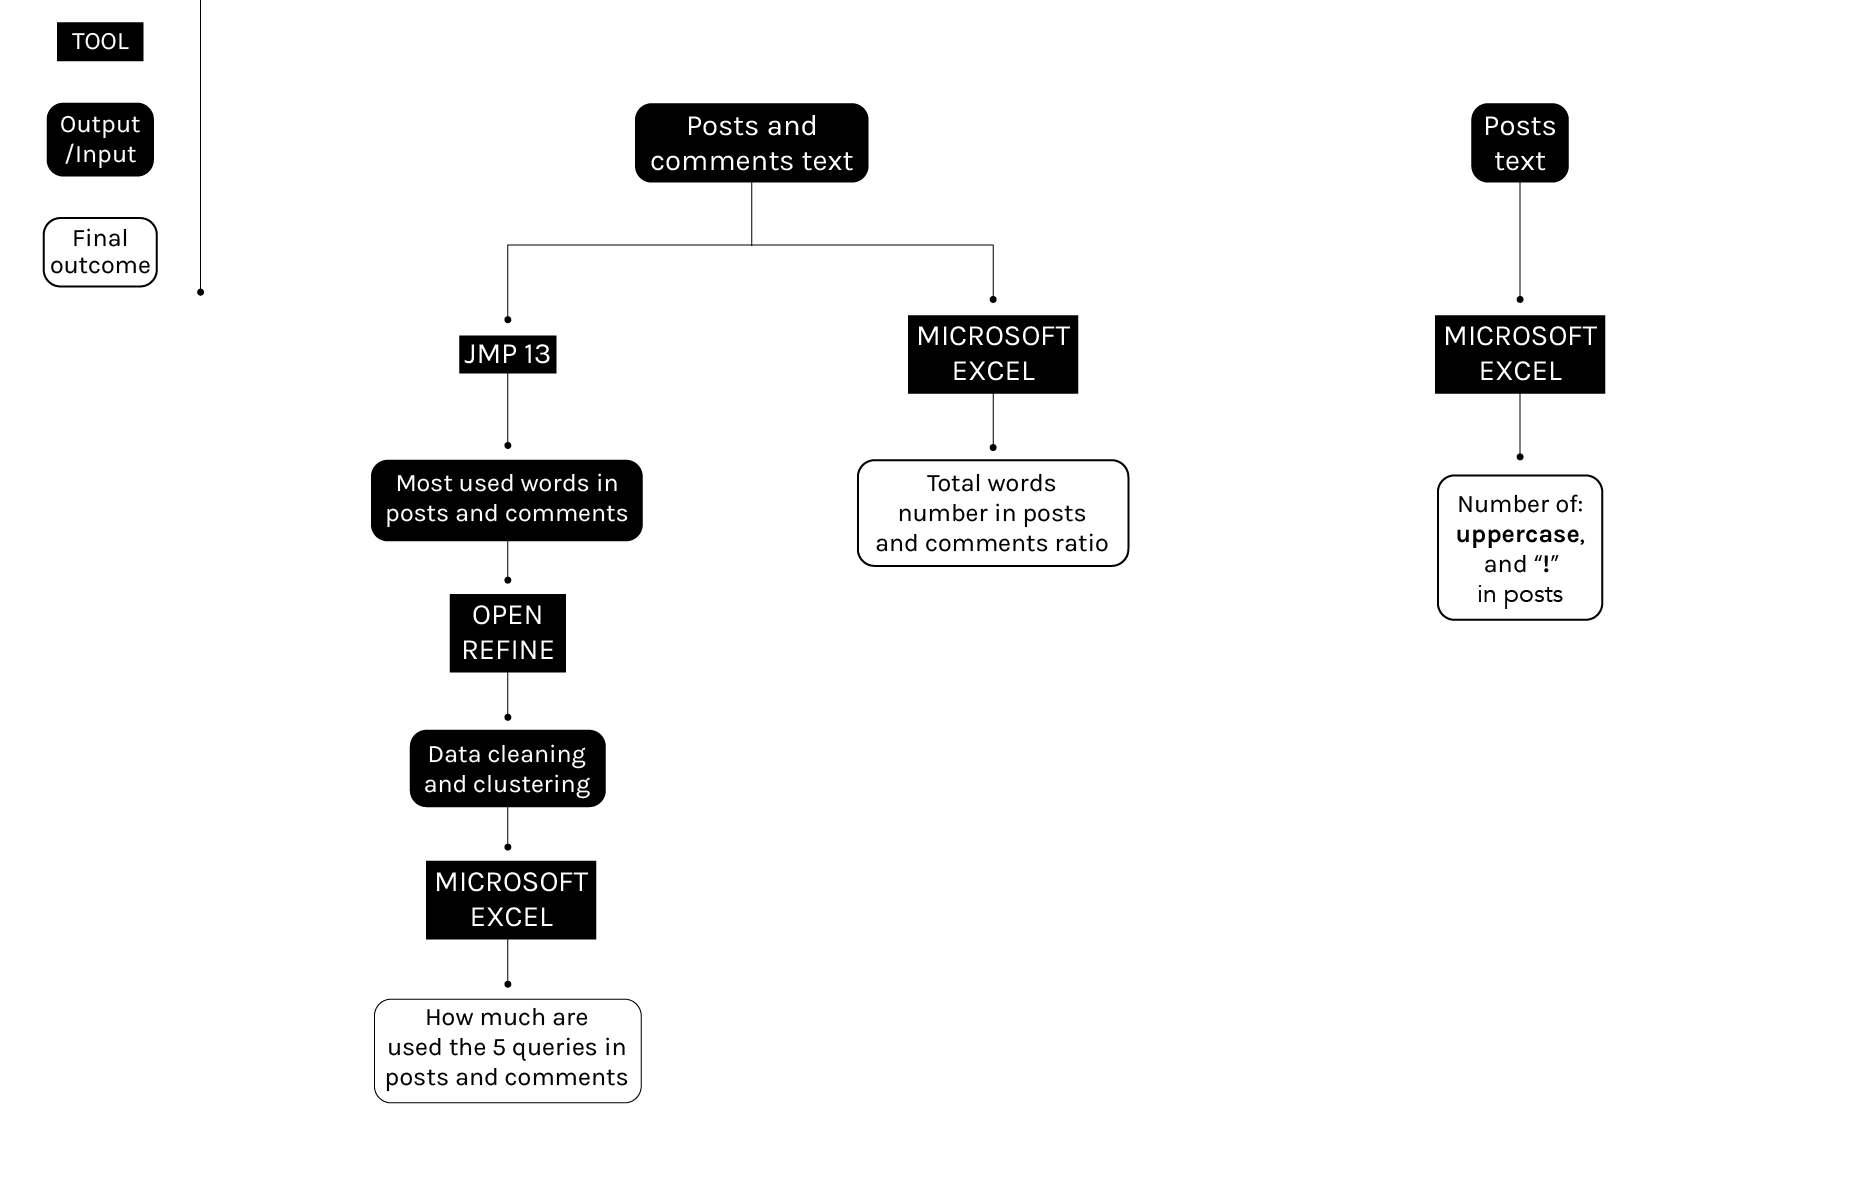
Starting from Google Trend to find out the five most frequent terms typed in Google search in 2016 to refer to migrants, we would like to trace how the different tribes call migrants. As result this visualization shows the most used terms in actors’ posts and people’s comments with the purpose to understand firstly if there is a strong similarity between the influencer’s language and the one of followers and secondly to observe if there are significant differences between the different actors. The visualization underlines a general conformity to influencers language. Except for Guardia Costiera’s page (which posts and comments generate strongly different patterns) and for Marina Militare (which as already told doesn’t posts anything) in the other Facebook pages is always possible to notice similar patterns. At this point another evidence is that the majority of the followers’ patterns are “polluted”; with this term we mean that while the main trend reflects the one of posts, it is possible to notice few cases of other terms usage. Inferring that, adopting the same words used by the influencer indicates a penetration of followers by actors’ storytelling, we can assume that the polluted tribes are less penetrated than the non polluted ones. It is obviously impossible to say, from this analysis, if the pollution is generated by non penetrated tribe members or if its cause is ascribable to the significative presence of external points of view. Despite this fact a high presence of pollution denotes an enfeeblement of tribal environment.
It is possible to notice that the language of pages like Lega Nord, Matteo Salvini and Casapound, which mostly use terms like “profughi” and “clandestini” are much similar to their followers, though in Lega Nord posts the word “Rifugiati” is never used. Between those three pages, Matteo Salvini page’s comments and posts are the more superimposable one. UNHCR also have a high degree of proximity between posts and comments and a low pollution though it only uses terms like “migranti” and “rifugiati”.
The most polluted pages are Matteo Renzi, Angelino Alfano and Amnesty International ones.
Generally the samples are irregular, so it is only possible to have a comparison between pages trends. The displayed values only stand for the maximum and the minimum number of words into the different samples.
The second visualization describes the text entropy of the different tribes, this index is expected to indicate how much sectorial the language of actors and followers is. It is interesting to notice that generally comments are much more sectorial than posts.
Comparing the values of the different tribes it is possible to notice that Salvini, Lega and Guardia costiera are the most sectorial in reference to comments. Lega Nord and UNHCR write instead the most sectorial posts. As shown by the bar chart those last two tribes are the ones in the aggregate which entropy index is lower.
A compared view between the actors can be biased; indeed the degree of entropy is calculated in percentage on the base of the number of times that the same words are repeated. Being the samples different it is possible that their analysis shows some distortions; generally the smaller they are, the more distorted they can be.
Anyway, for what concern posts, comparing this values with the ones of chapter two it is possible to see that much of the tribes described as sectorial are strongly active on Facebook writing a great quantity of posts. As displayed by that visualization, the only pages on which the number of posts overcomes the number of 100 are “Lega Nord”, “Casapound”, “UNHCR” and “Matteo Salvini” which are the last in the ranking of text entropy (under the entropy analysis bar chart). For what concerns comments, the bias probably vitiate Guardia Costiera’s page.
The interesting thing is with a general overview is that the four pages: “Lega Nord”, “Casapound”, “Matteo Salvini” and “UNHCR” (as displayed by the fourth chapter and more evidently in the fifth one) were characterized more than other pages by a one-side view; against migrants, for what concerns the first three and pro migrants for what concerns the last one. Therefore it is possible to hypothesize a connection between the sectorial communication and the involvement in a particular topic.
In the third representation, the bar chart displays the exasperation of the language of the followers of the different tribes. Some tribes, like the one of Papa Francesco, Casapound, Lega Nord and Alfano use more emphasis in expressions by using a huge percentage of caps in their comments; Casapound and Lega Nord make an exception because write a considerable percentage of caps in comments and use a large number of exclamation points.
The data is not exactly connected to the real situation, indeed it also includes the percentage of capital letters at the beginning of phrases. Despite this fact, the big difference between some pages is strongly representative of an over-usage of the caplock.
Crossing the values of exasperation of language and the sectoriality of the vocabulary of the different tribes we obtained a scatterplot that describes the predisposition of tribes to develop the phenomena of eco chamber.
As shown by the graph, the bottom left point, indicate the higher predisposition to the phenomenon by combining a sectorial vocabulary, that implies high repetition of same thematics and the extremization of emphasis in written expression.
From this perspective Lega Nord and Casapound are the closest to eco chamber, but also the tribe of Papa Francesco is really close to the max point too, due to the large use of capital letters, even if his tribe is not characterized by a sectorial vocabulary.