Description
The scatter plot shows different countries clustered per automation potential of wages and employees so the clusters don’t represent the economic power of every single Country however through the automation potential it is possible to locate similar Countries in similar clusters. UBI pilots are equally distributed in each cluster, not only for high automation potential Countries or for Third World Countries, and it is interesting to see that initiatives for UBI are independent from Economy and Technology of the different Countries and they are apparently sustained for social purpose.
Protocol
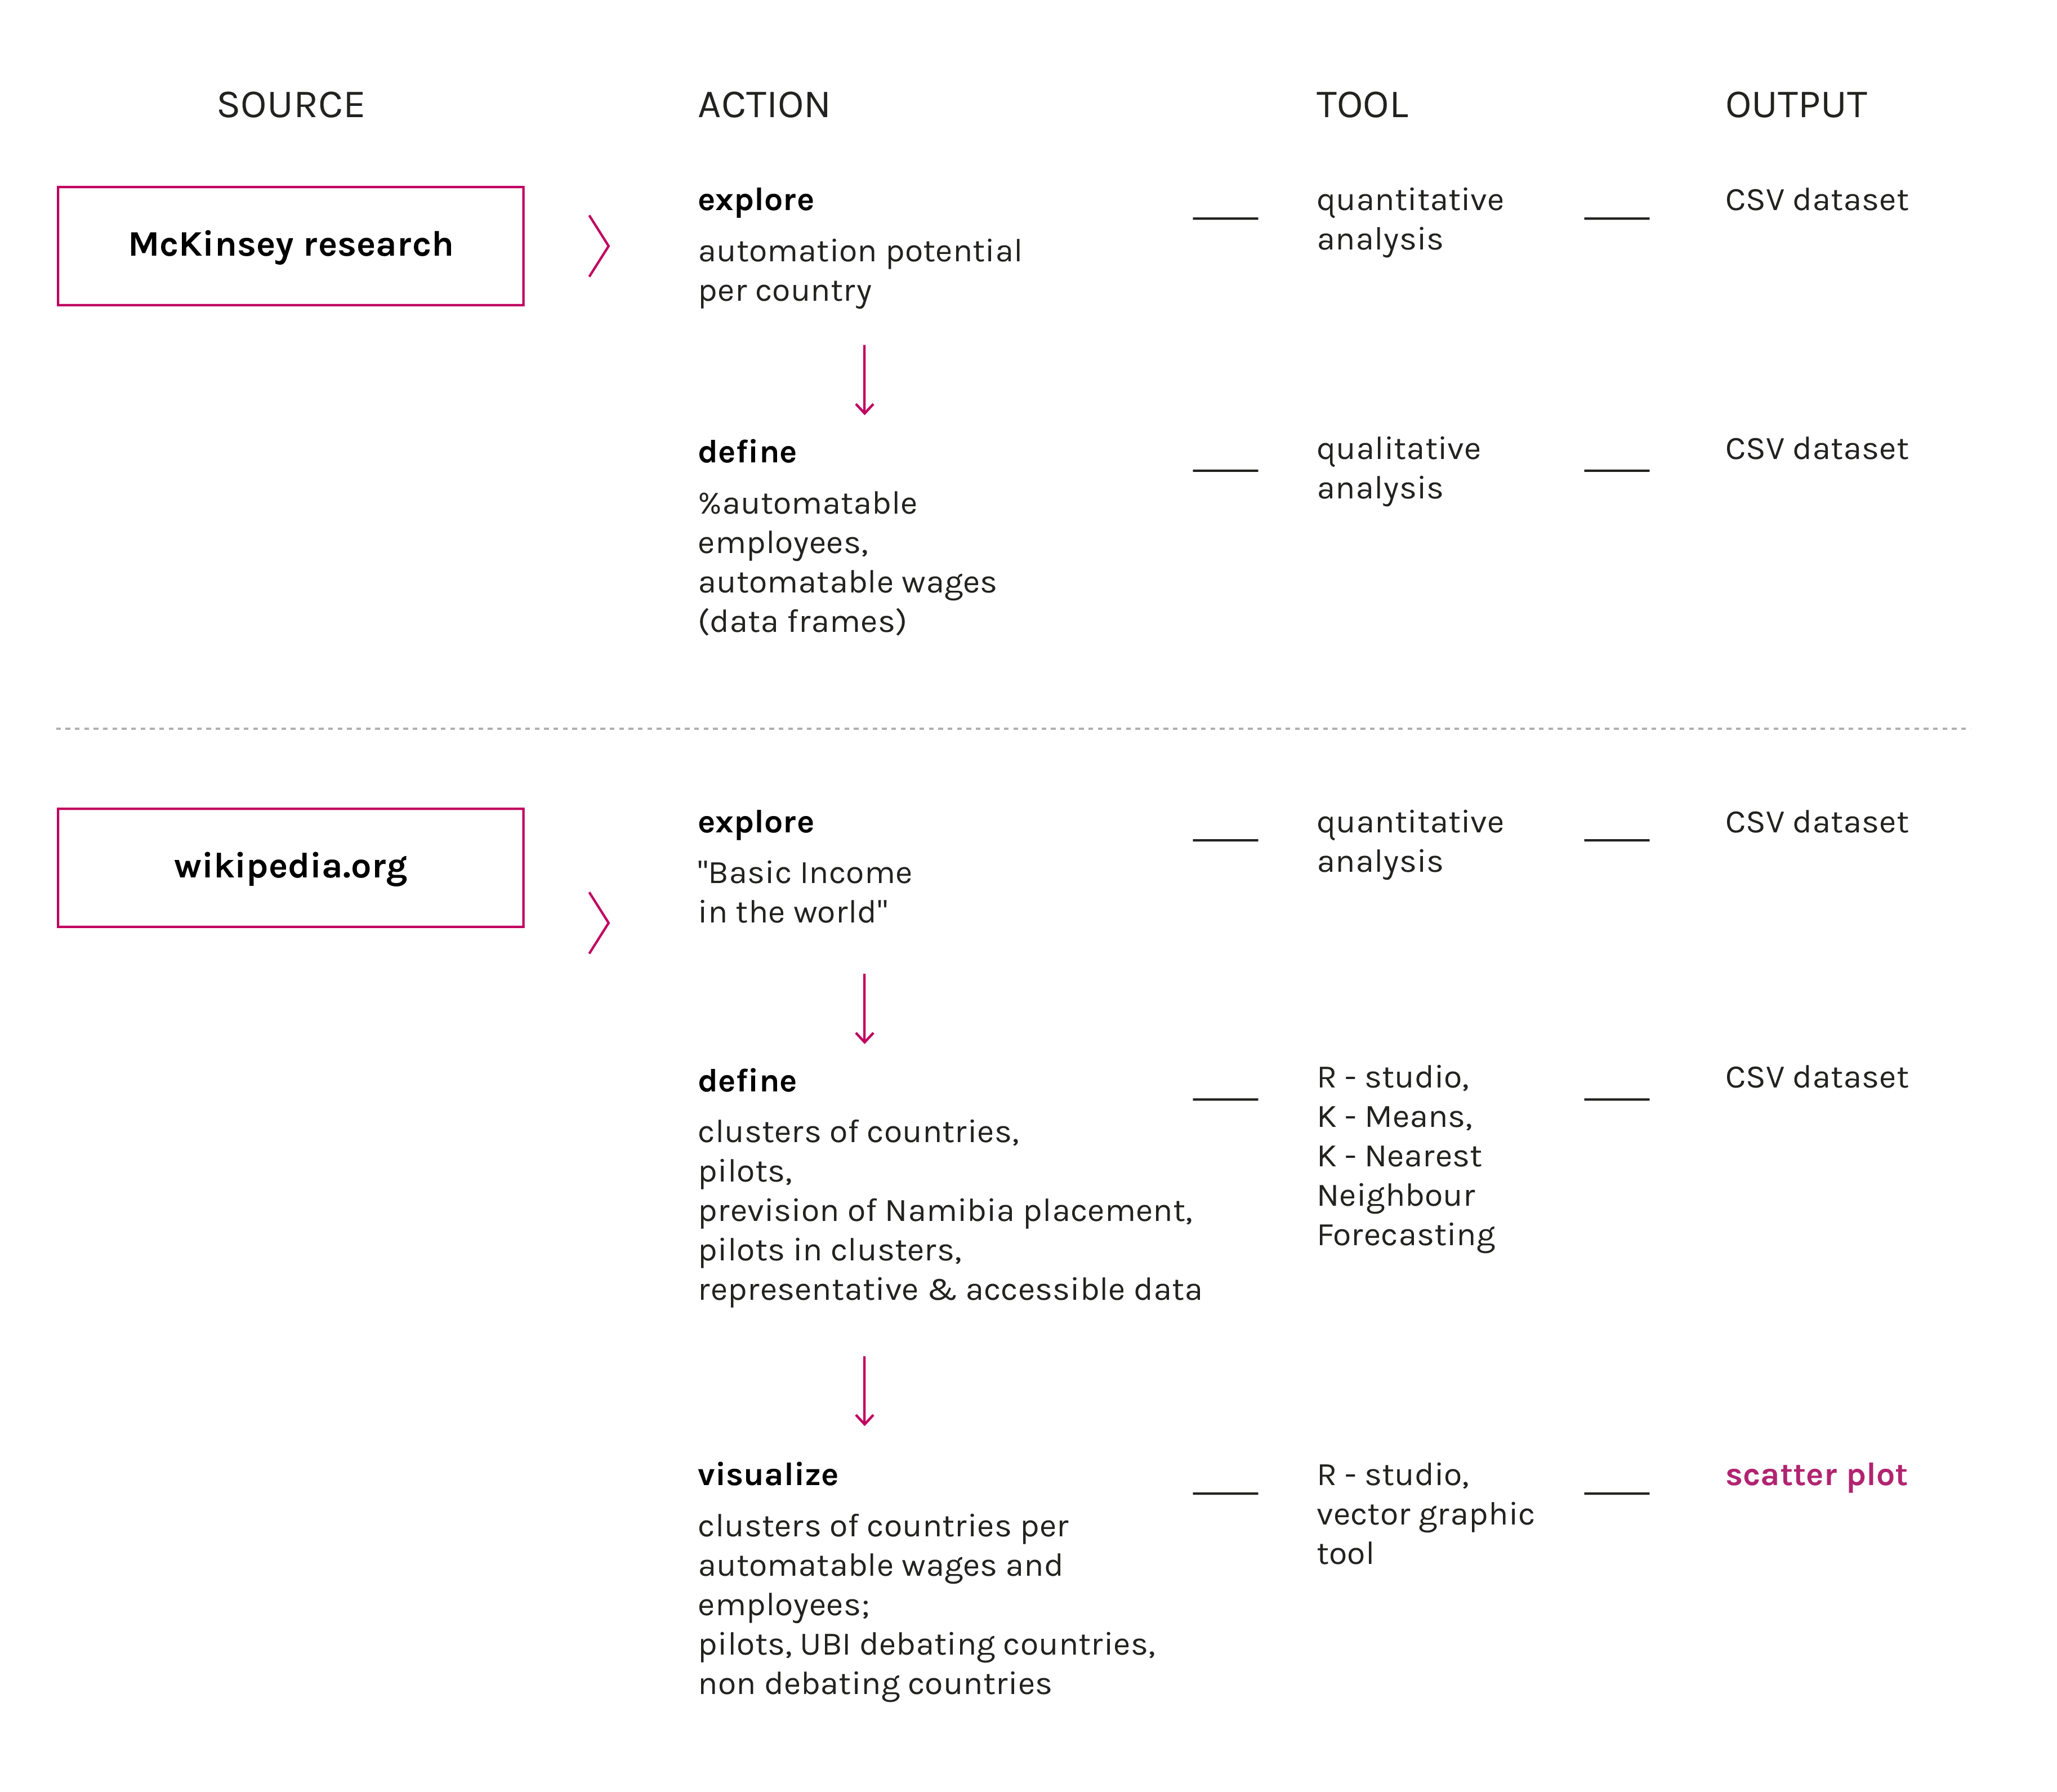
To make this visualization the “Automation potential dataset” from McKinsey and the Wikipedia list of UBI pilots are criss crossed together to make clusters and points what Countries are arguing about basic income. The graph was made with R-Studio and refined with a vectorial graphic tool, clusters are made with the K - Means function. Furthermore data of Namibia (that is one of the pilots) were missing and one cluster would remain without an important pilot, so it was necessary to make forecasts with the function K - Nearest Neighbour Forecasting.
Data
Timestamp: 01/1/2004 - 15/11/2017
Data source: Wayback network per year
Download data (162kB)
The McKinsey dataset from the phase 1 was taken and was crossed with the wikipedia list of UBI pilots.