Description
the first graph shows what are the different image subjects in each Country. Through this graph it is possible to see what are the differences and what the analogies between pilots in the way of telling and representing the UBI issues. For example it is possible to see that its pilot is the main subject in Canada and People is the main in Namibia and Kenya.
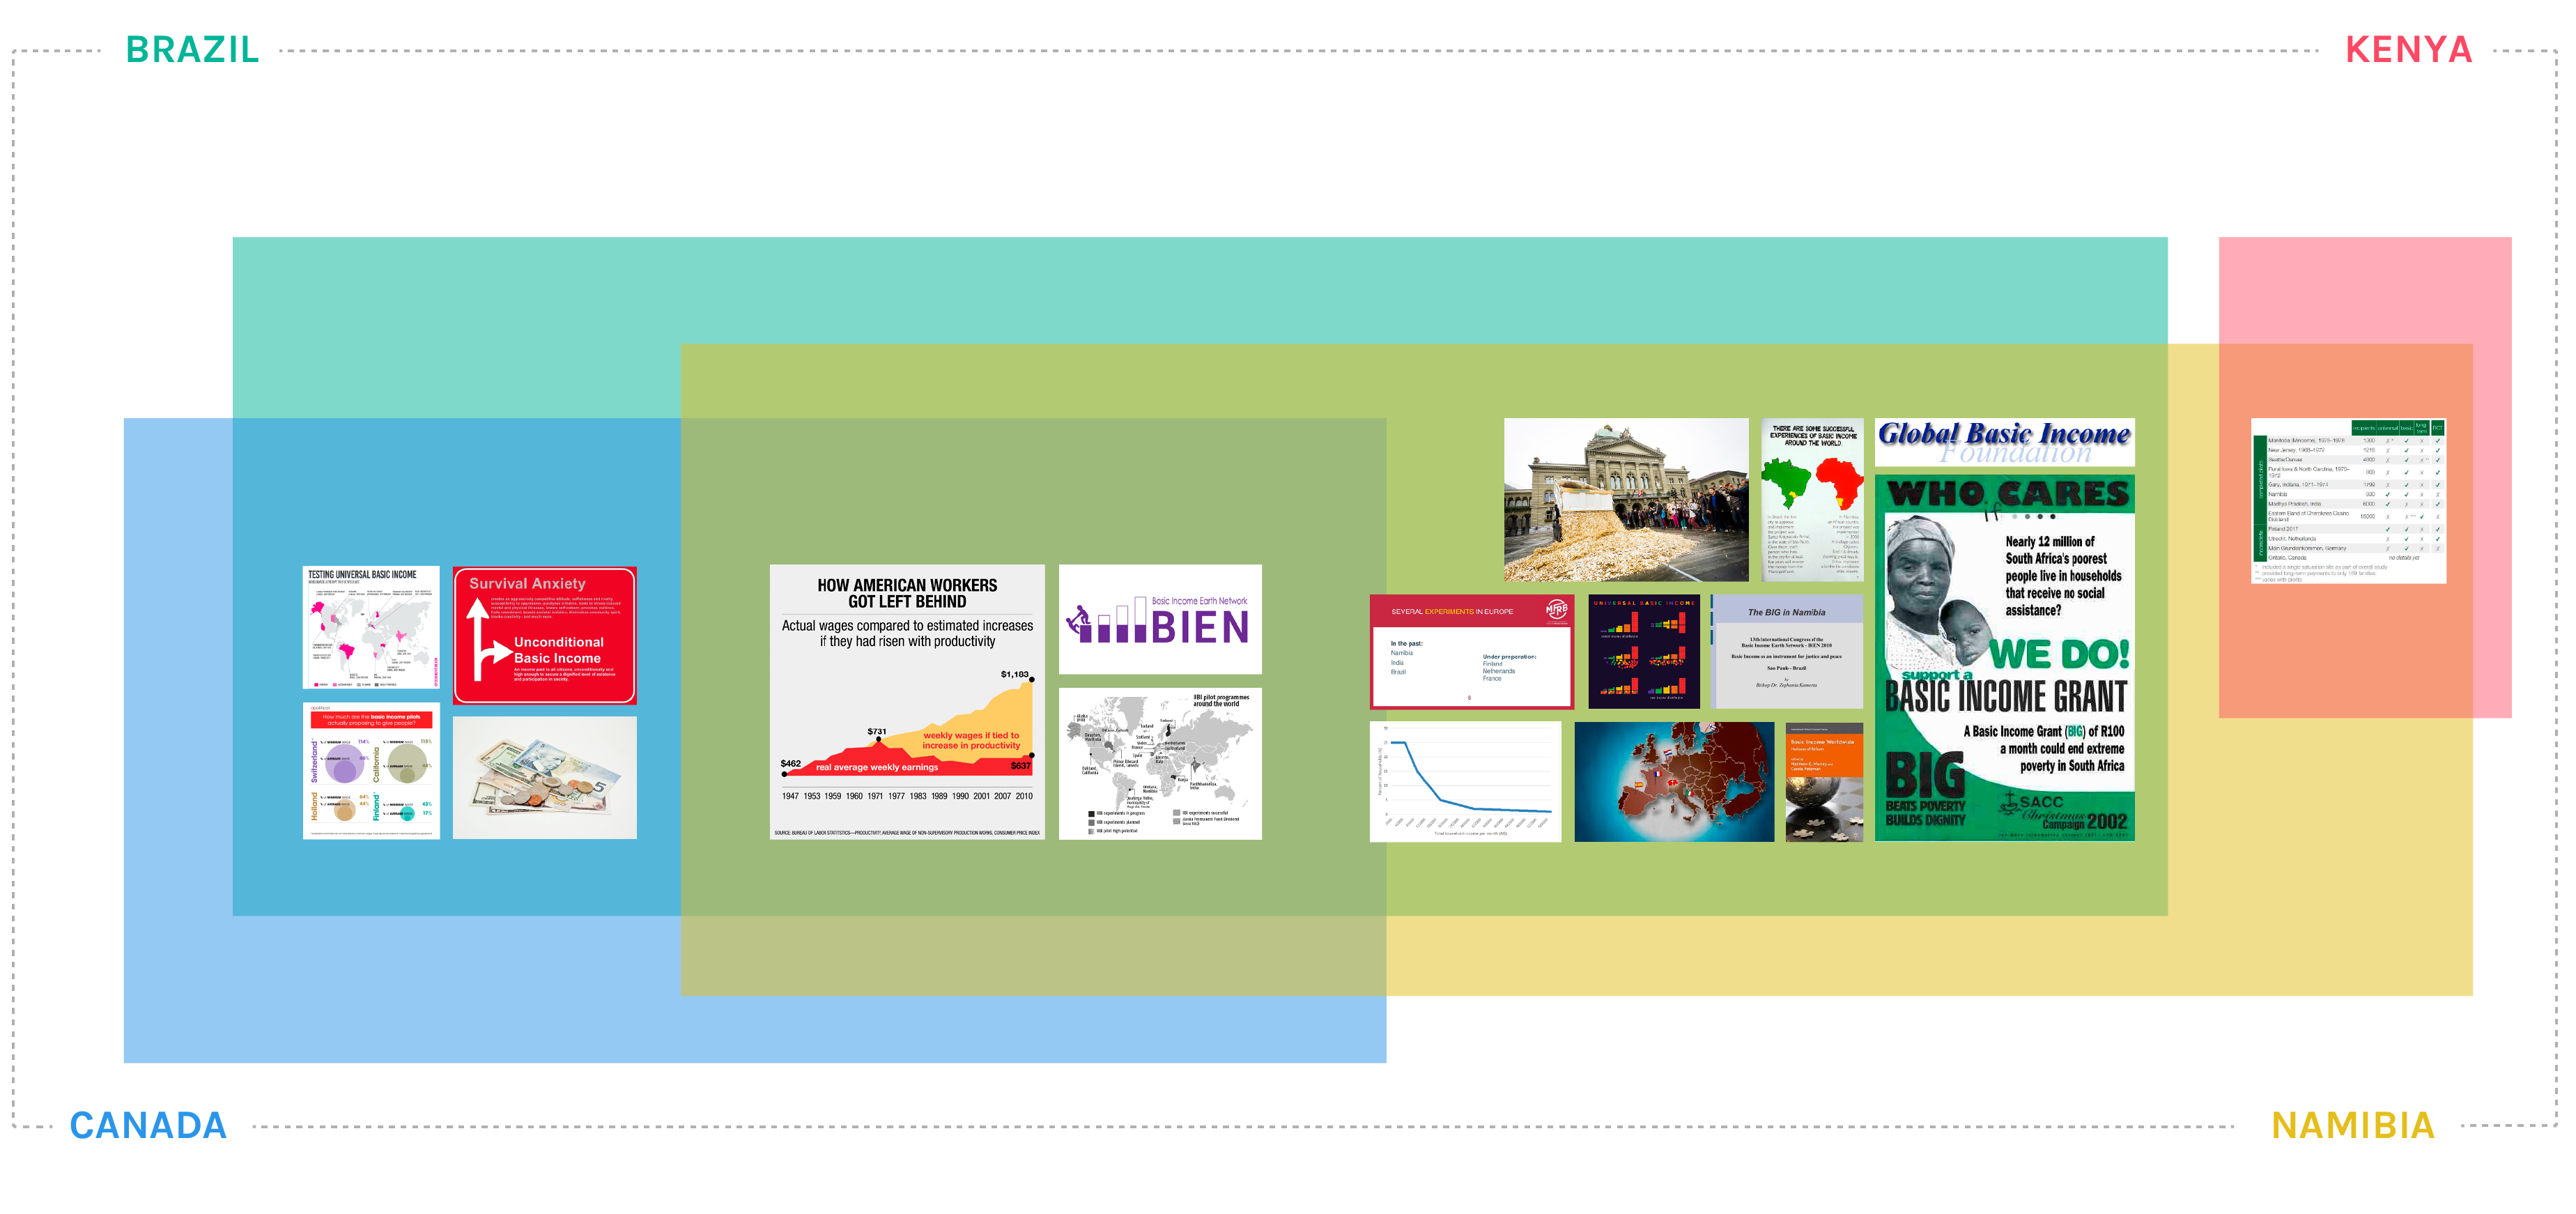 The second graph shows what images the Countries have in common. It is curious to notice that Brazil is the Country with more images in common with others; this could be the reflection of the particular social features of Brazilian population with its wide economic discrepancies that make Brazil in the perfect middle between the fast economic development of Countries like Canada and the harsh condition of life typical of the Third World.
Protocol
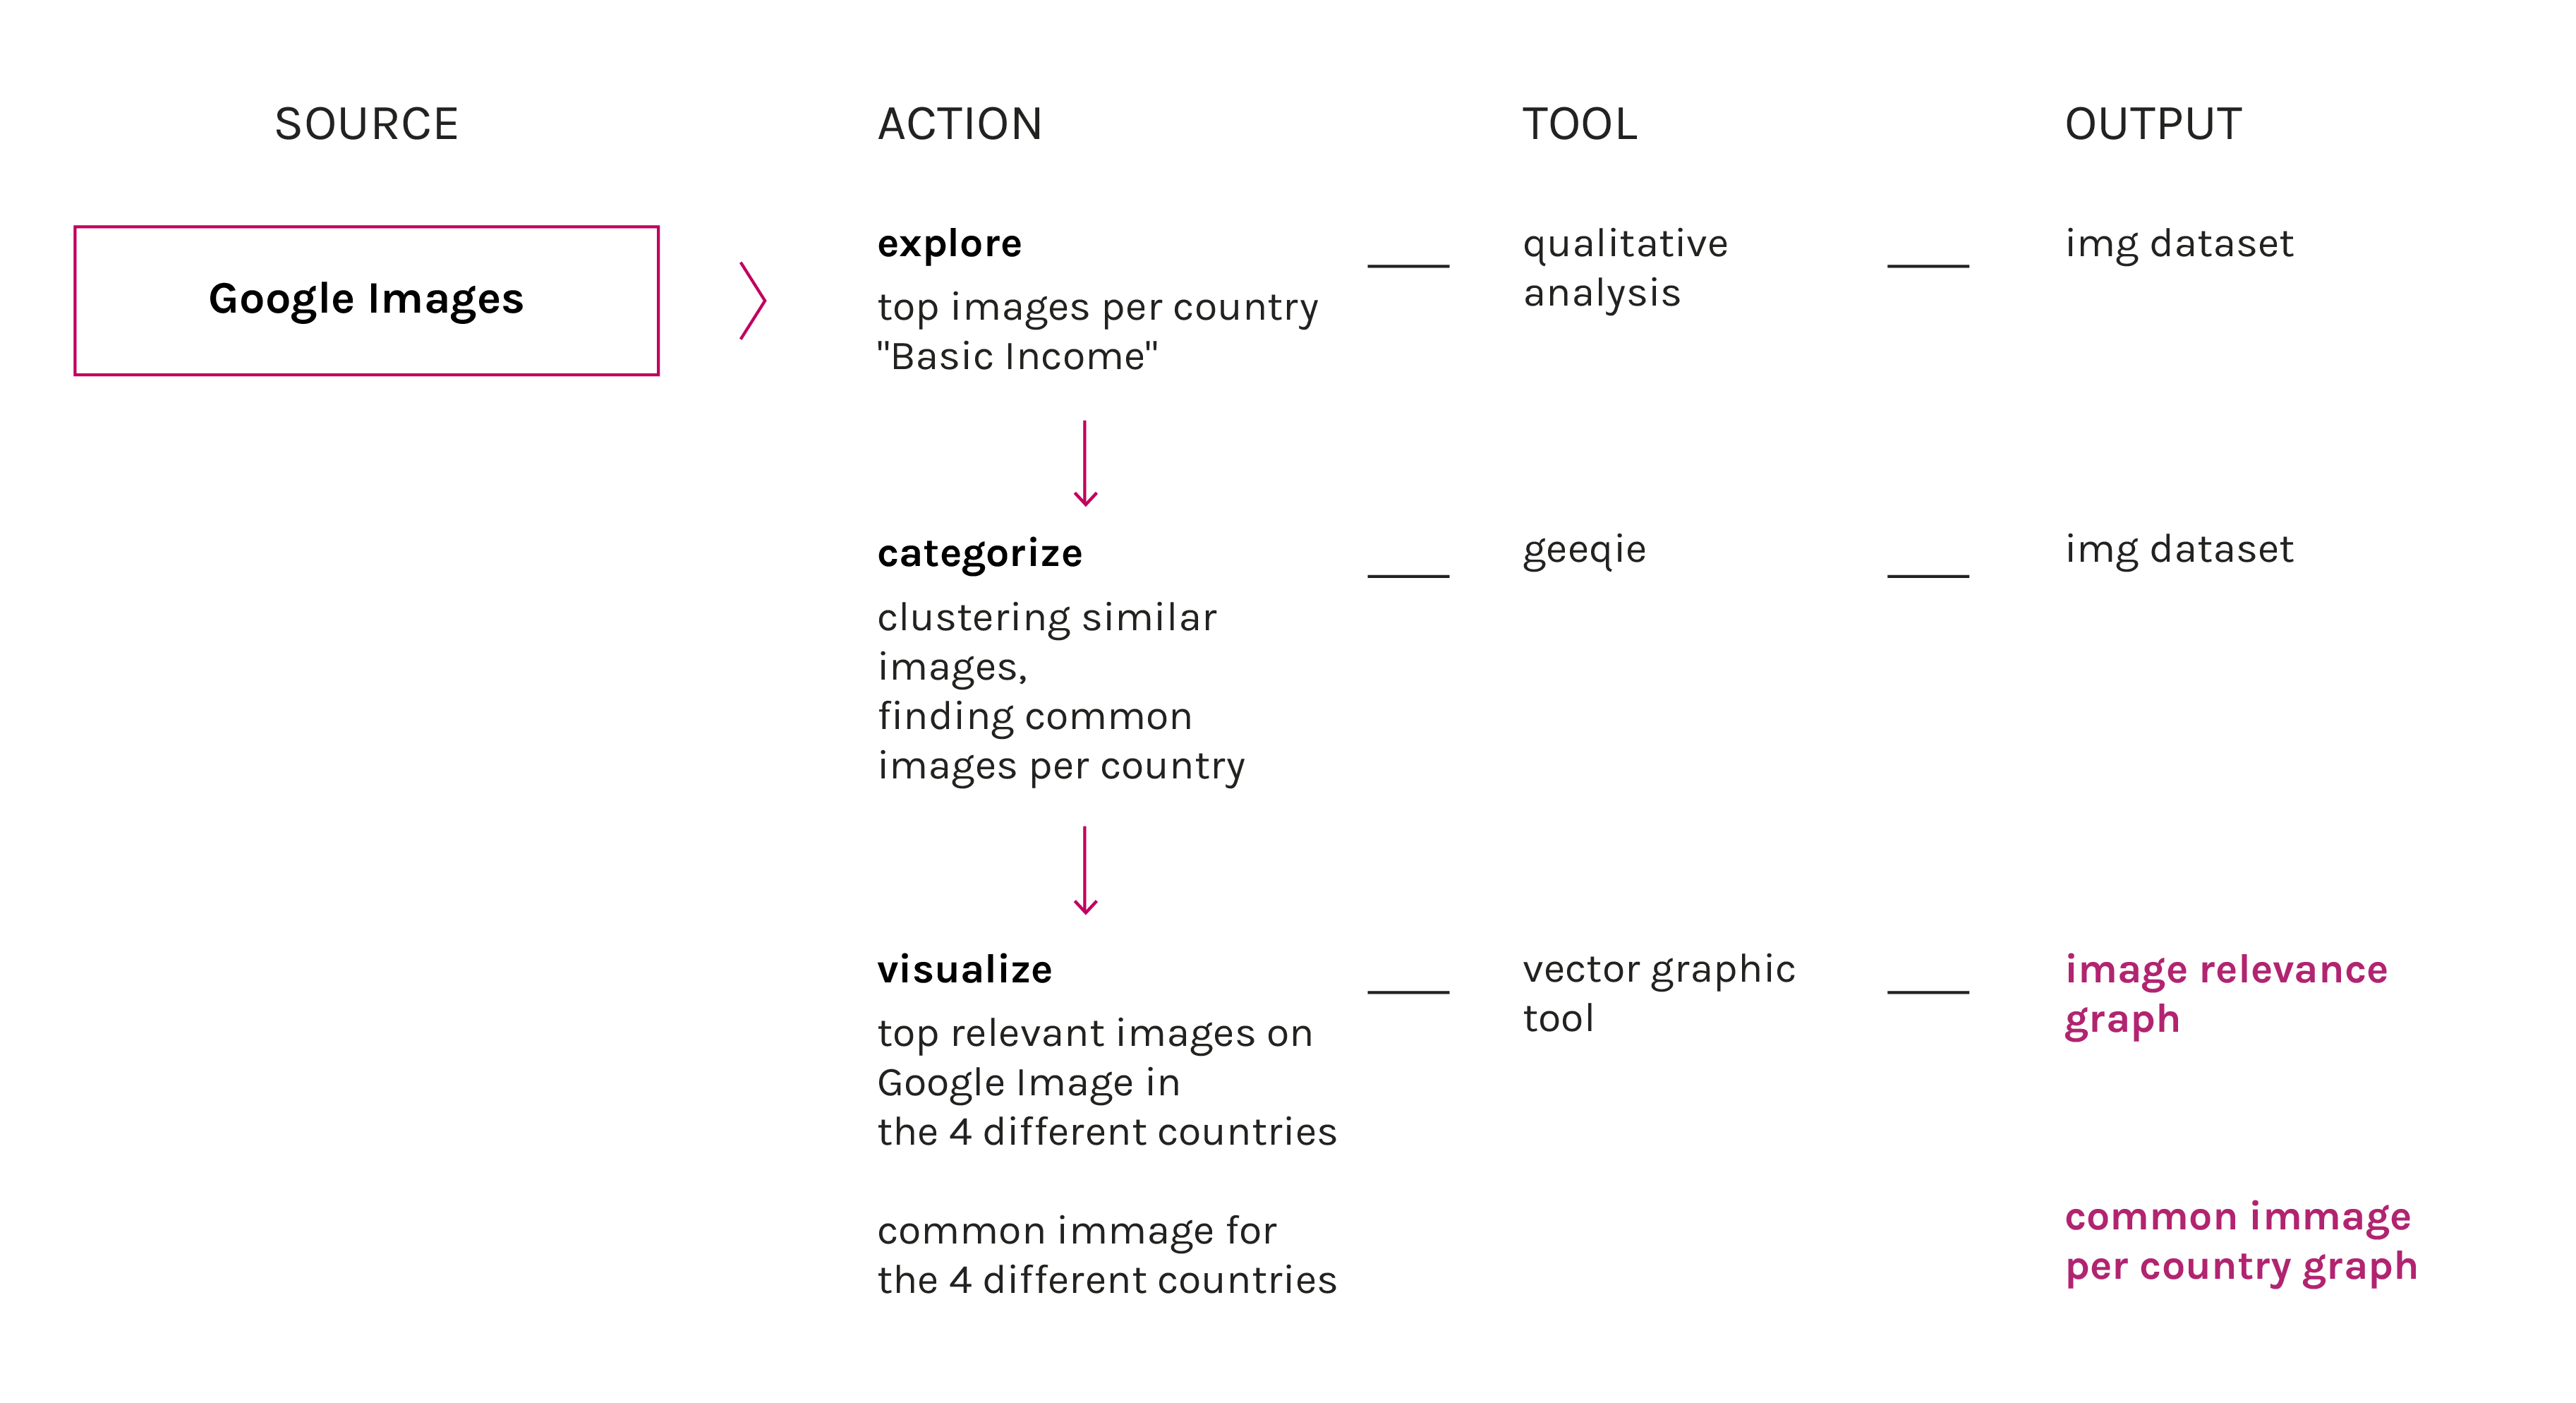
Localized Google images was scraped and the first 100 images, after the query “Basic income” was entered, were collected and manually tagged for its content. Afterwards,one image per category was chosen, and said images were rearranged and resized to show the amount of said category. Each image height represents its percent value on the total of images tagged.