How to read the visualization
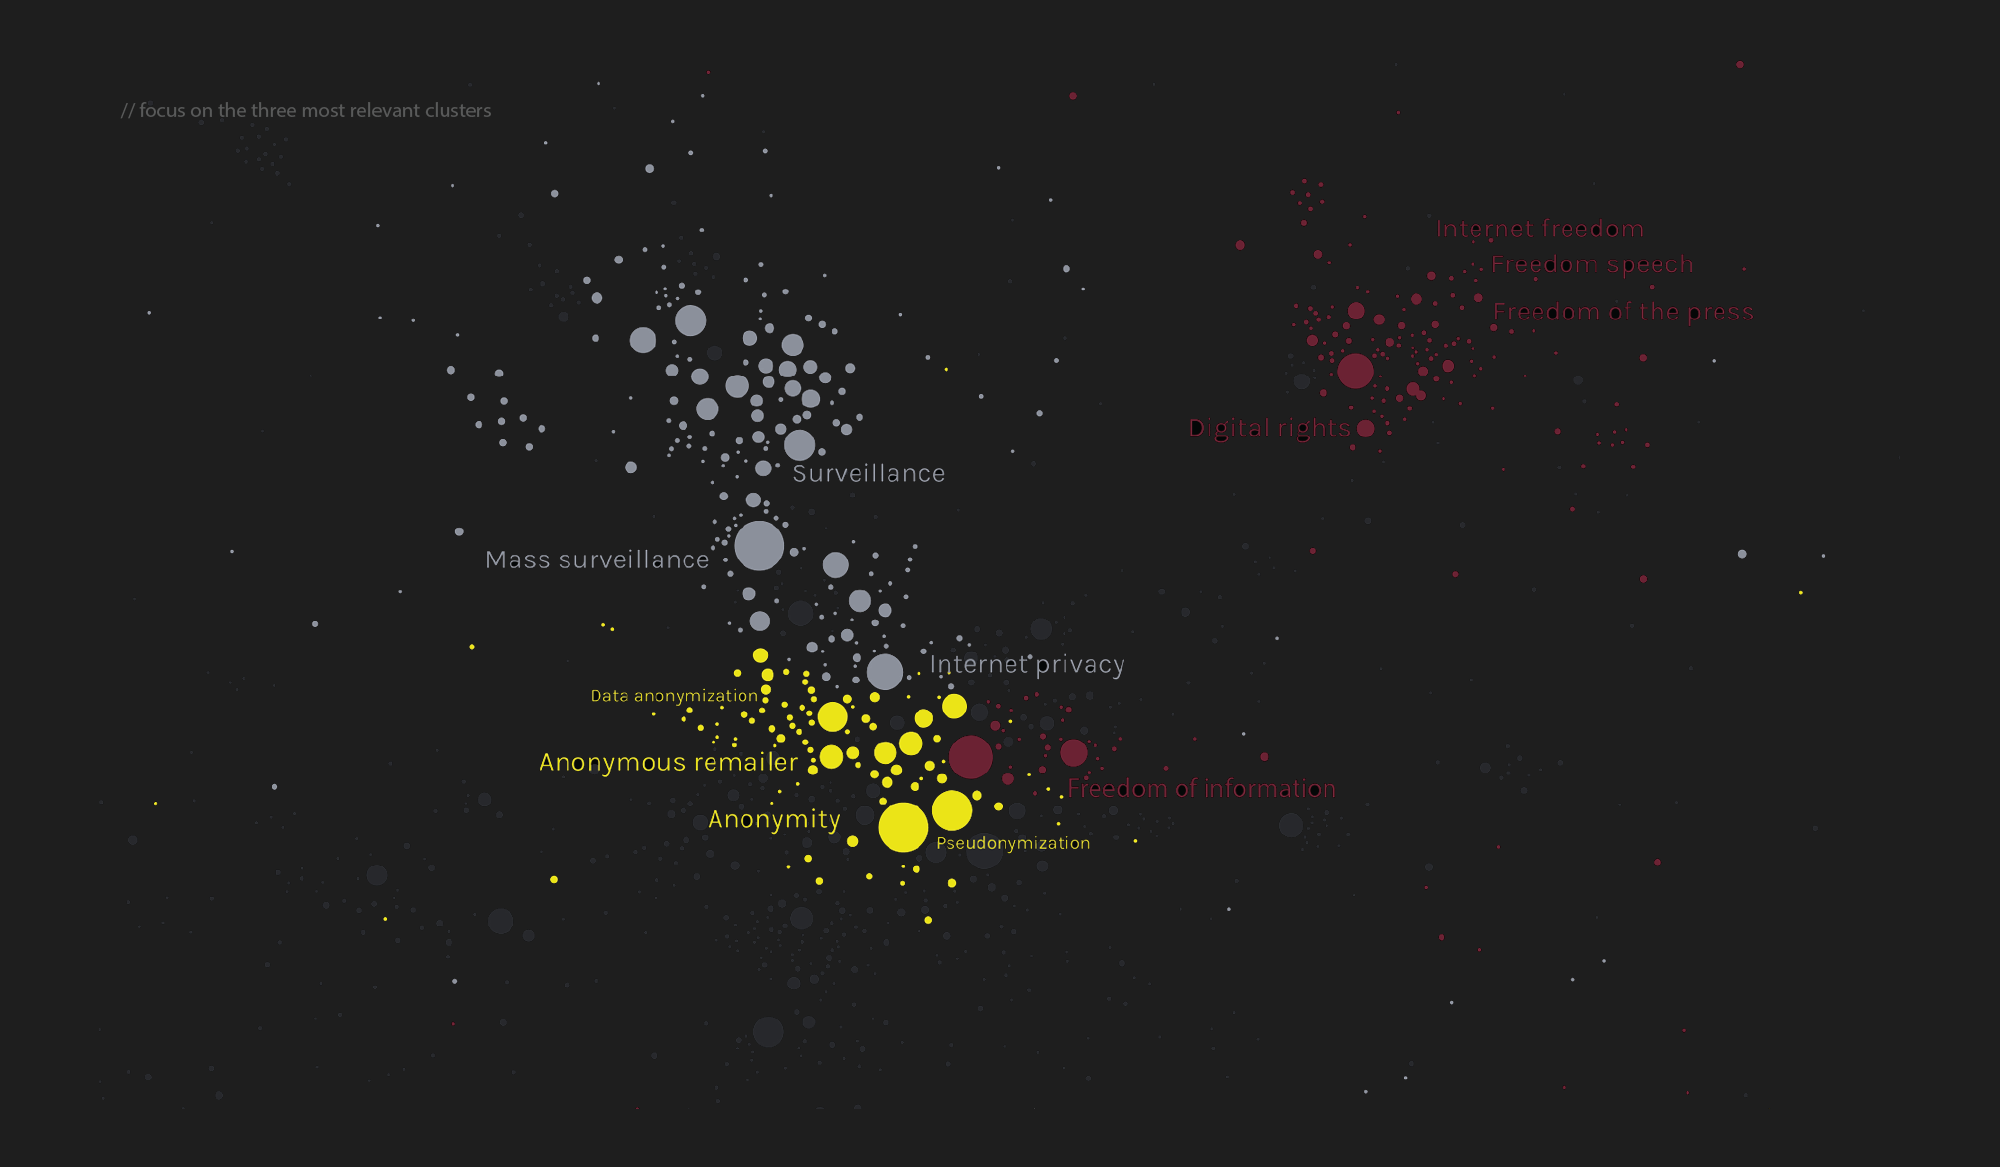
The visualization is presented as a huge network containing a lot of bubbles and connections. Each bubble represent an article of the corpus. The dimension of each bubble is determined by the amount of connections with other bubbles. The biggest bubbles are the most important one into the net. Clusters are distinguished by colors. A cluster is a group of similar articles. Each cluster has a color and a particular position into the net. The more a cluster is isolated and positioned far from the center, the more it is defined and separated from the rest of the arguments. On the other hand the clusters that are really closed to each other are difficult to divide because of the interconnection among the articles.
The net is interactive so the user have the possibility to easily navigate it. It is possible to distinguish in the net four concentric levels. The first level is the central one, a macro-cluster containing different arguments. The second one is positioned immediately close to the center presenting specific articles (as the anonymous group and cyber-crime) but not strictly inherent wiyh the anonymity theme. The third and the fourth ones are constituted by a lot of smaller articles far from the center containing really specific and delimited clusters not linked directly to the principal theme.
The second visualization is a focus of the same previous network and it is showed just to immediately visualize which are the interested clusters linked to the general theme of online anonymity. From this graph it is possible to understand which are the articles, and so the clusters, analyzed for in this research: anonymity and freedom of expression.


