Queries analysis

Protocol

Introduction

The described protocol represents the analysis of the first 100 Google results for six queries whose main topic is the mass surveillance:

- Warrantless mass surveillance
- Sigint mass surveillance
- National security mass surveillance
- Tech giant mass surveillance
- Privacy mass surveillance
- Nothing to hide mass surveillance

The final queries were chosen after two weeks of research on the topic "mass surveillance"; several tests were made up to find the solution that would return the most interesting results.

We also verify whether the arguments and polarizations were located heterogeneously within the google results and different corpus extracted with the six queries. As it turned out that there were no differences in this sense, we have chosen to create a single dataset on which to gain for following analysis.
The interactive visualization below shows where polarizations and arguments are positioned within the top 50 results for each query.


clarifyng the argument counter-terrorism disclosures human rights impact on society law aspect movement issue nothing to hide surveillance tecnology tech giant against in favour neutral 6 query results

Steps of the procotol

- disconnection from any Google account not to spoil the results of research;
- opening a new window in "incognito";
- opening Google.com;
- Google settings: "never show Instant results" and "shows 100 results per page";
- search for the query and analysis of the first 100 links to see if the query is or not relevant to the subject analysed;
- (if the query is relevant) viewing the source code of the page (view/options for developers/view code) and copy the entire code;
- extraction of 100 links for each query using an URL extractor whose settings have been so setted: extract "full URLs" and output "in plain list" "to the browser" "with unix line break", URLs to ignore "google.translate" (to begin to skim the unnecessary pages);
- elimination of double or corrupt link;
- creation of a table on Google Drive where all members of the group can work, formed by several columns to analyse the link, where you can enter: query name, links to pages, pertinence, media type, site name, location, date, author’s name, author’s profession, contents of links, title of the article and polarization taking account of content and debate;
- opening of each link to select its relevance based on the content and analysis, for those deemed ok, the items defined by the table (tag of contents emerged to highlight features useful for the construction of the visualizations);
- standardization of the dataset obtained by finishing any terms slightly different from others;
- creation of a specific dataset for each view based on what we want to bring out. Each visualizations then follows its own path from the total dataset containing all queries.

PROTOCOL SPECIFICATION FOR THE DIFFERENT VISUALIZATION

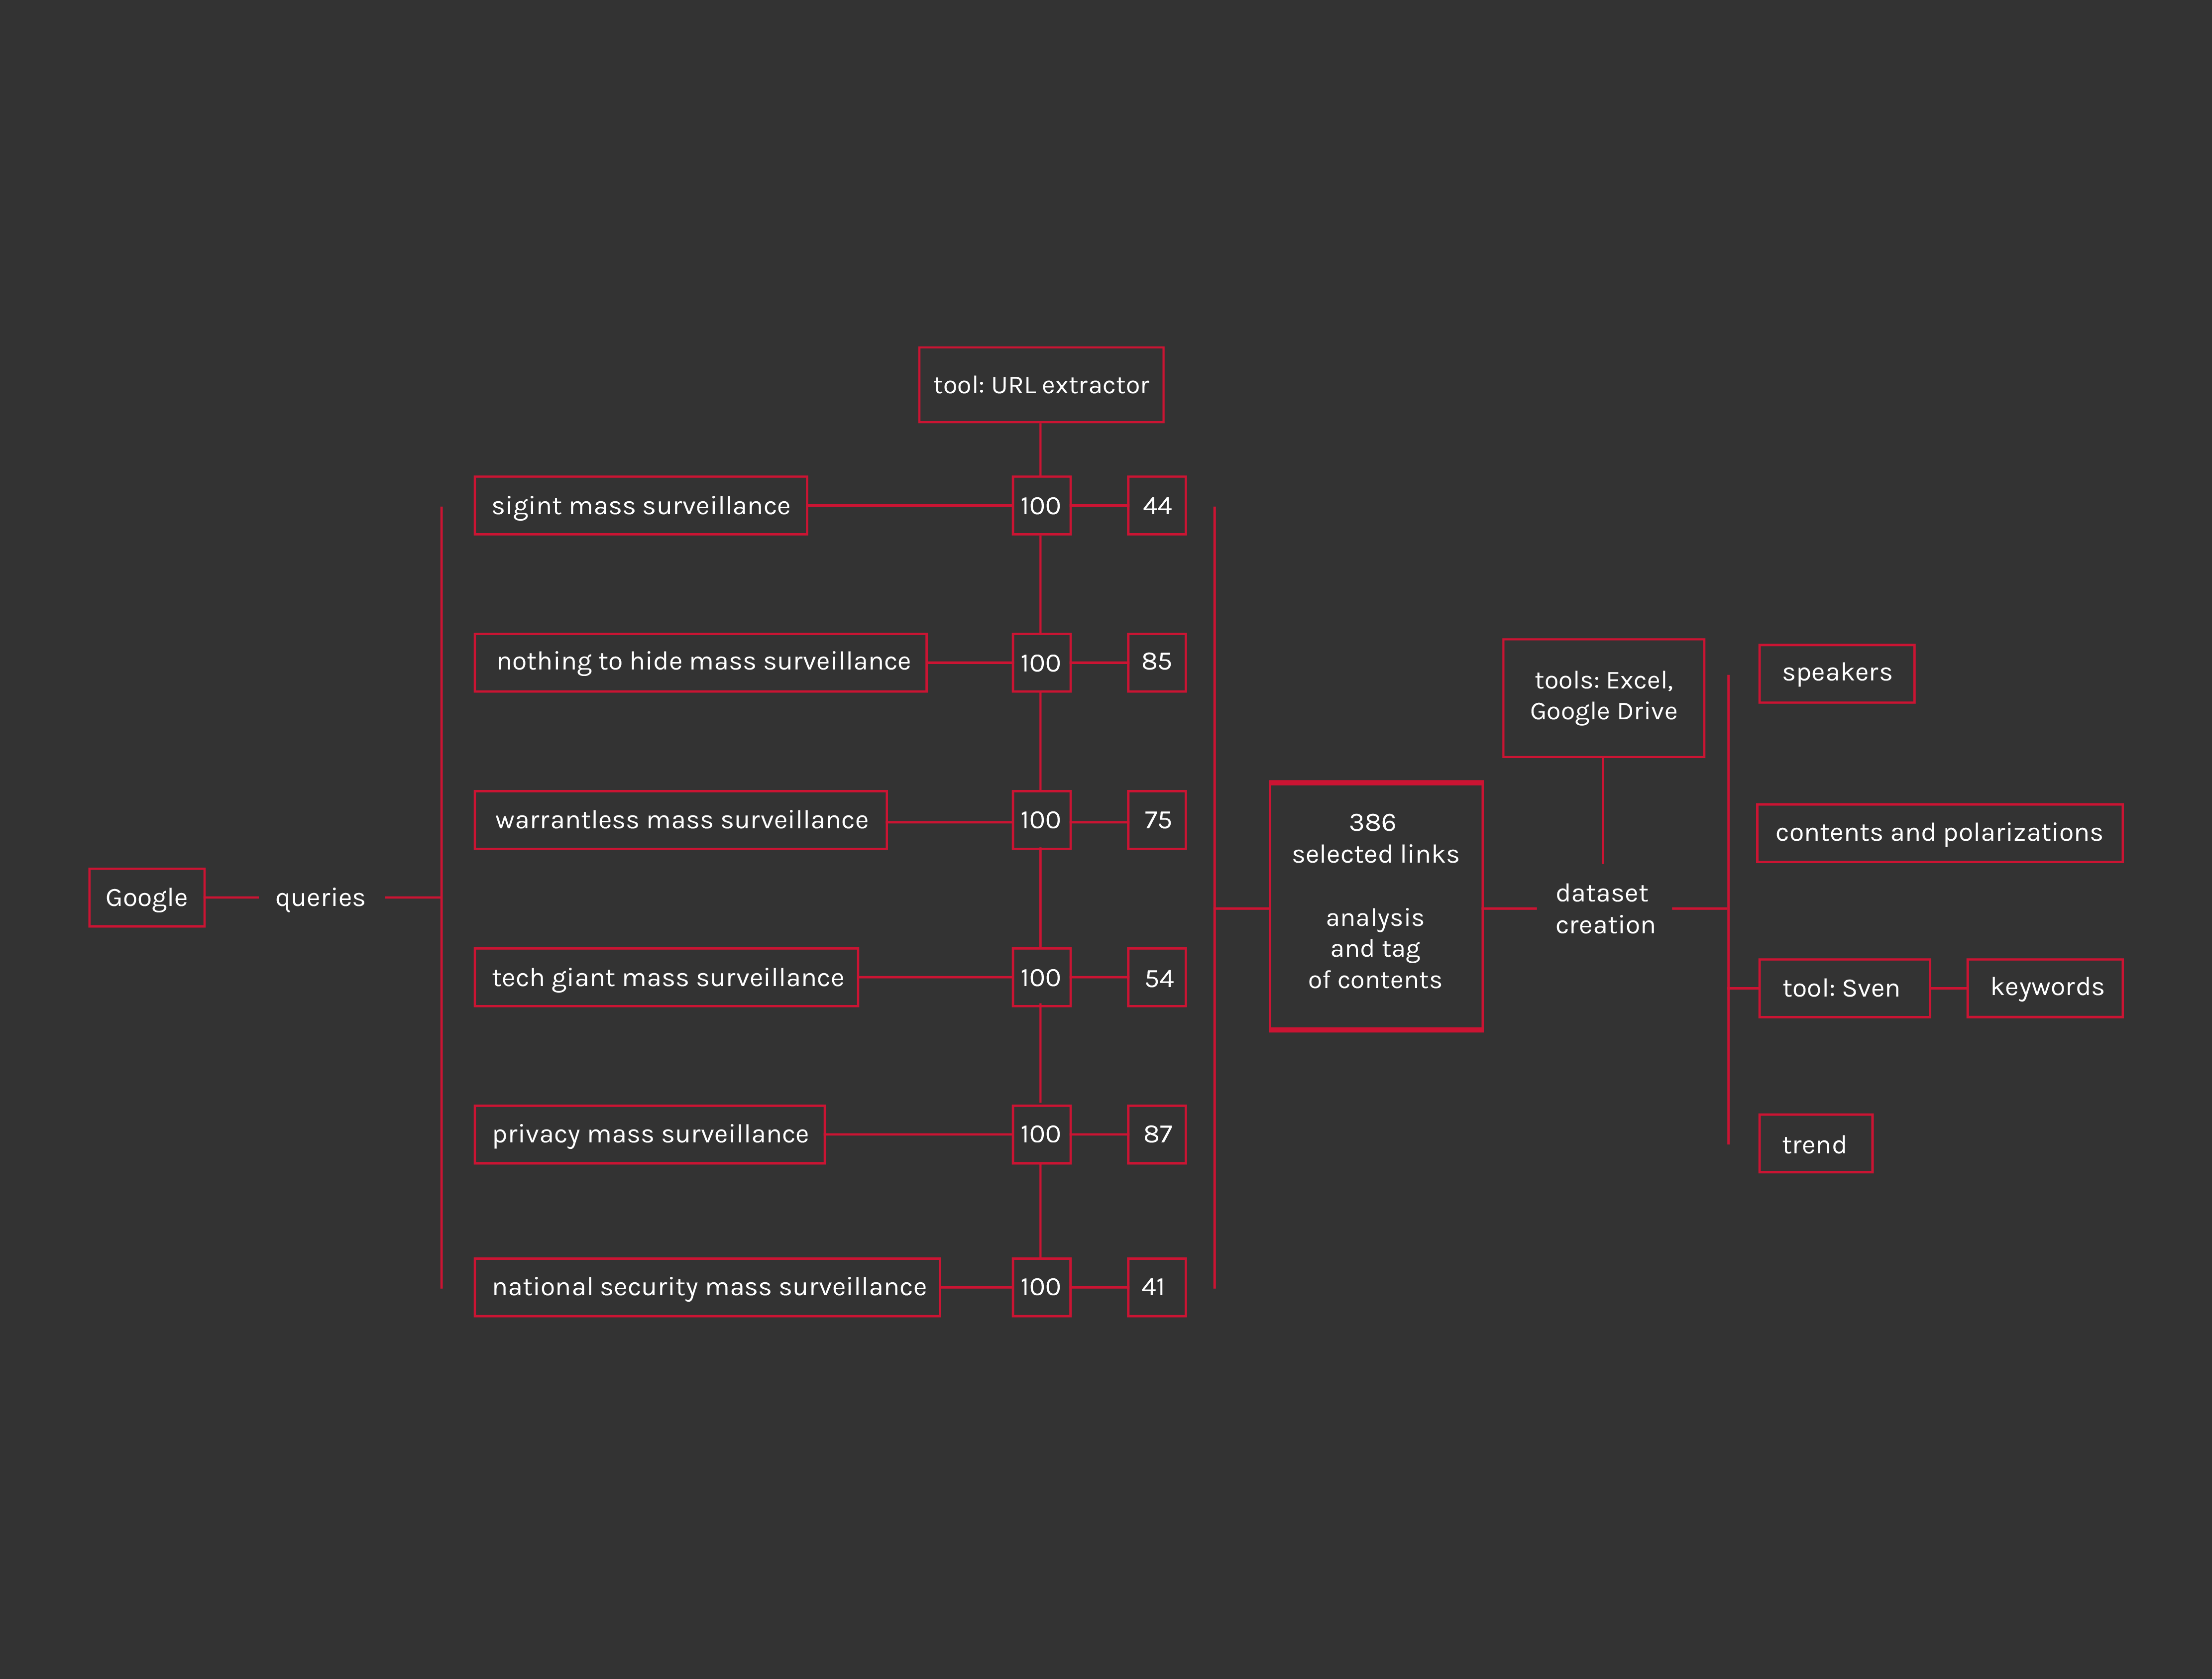
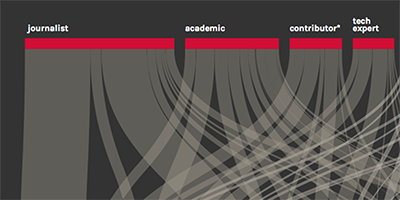
VIZ_01: WHO IS TALKING

data source: corpus dataset
data selected: author profession, media type
Creating (starting from corpus dataset) a csv file containing only data relating to author profession and media type.

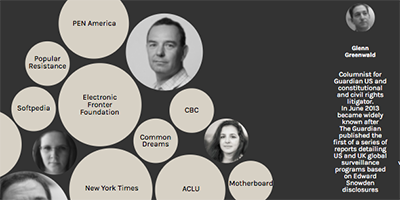
VIZ_02: SPECIFICATION OF SINGLE SPEAKER/PARTICIPANT

data source: corpus dataset + twitter and wikipedia
data selected: author name, author profession, website name, polarization
Creating (starting from corpus dataset) a csv file containing author name, author profession and website name who have written more than one article of the corpus, everyone associated with the number of repetitions. To each person we have also associated the number of follower and tweet. The five most important authors are presented with a short description comes from personal profiles and wikipedia.

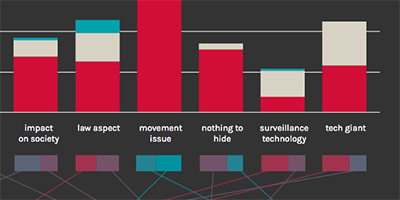
VIZ_03: POLARIZATION WITHIN THE MOST RELEVANT TOPIC AND MEDIA

data source: corpus dataset
data selected: topic, polarization, media type
Creating (starting from corpus dataset) a csv file containing topic, number of pages for topic splitted by polarization (in favor of surveillance, against surveillance, neutral) and the total of the speakers who talk about that particular topic. In addition, for each topic are presented the two media that speak more, information obtained by a simple counting operation.

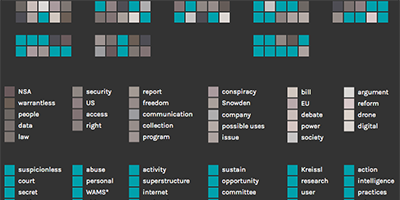
VIZ_04: SPEAKERS AND RELEVANT WORDS

data source: corpus dataset, Sven
data selected: link, author’s profession, polarization (corpus) + word, tf valor (sven results)
Creating a specific dataset to categorize Sven results: - creation of file containing links, categorised by media and polarization; (es: academic_against.doc, academic_neutral.doc, academic_infavour.doc) - extraction of txt through Zup - txt organization in groups/folders relative to media and their polarization (es: ..>academic>against, ..>academic>neutral, ..>academic>in favour) - Sven: creation of a corpus for each txt group/folder, analysed separately - selection of Sven results with the highest tf value and incorporation with the previous dataset - creation of a csv file with the repetition count of the selected word.

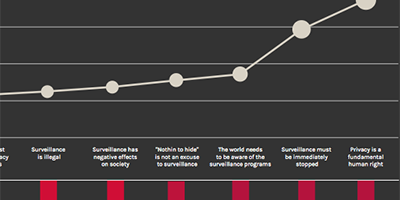
VIZ_05: WHERE THE DEBATE IS - TREND AND NUANCES

data source: corpus dataset

data selected: statement, polarization (against), author’s profession (against)

Creating (starting from corpus dataset) a csv file containing statement used for siding against surveillance and the number of pages for topic against surveillance. In addition, for each topic is presented the breakdown of the speakers who talk about it: for this purpose has been created another dataset composed by the number of speakers (author’s profession) for each topic as a percentage.

Metadata

Timestamp:
24/11/2014 - 10/12/2014

Data source:
Google

Tools:
URL extractor, Google Drive, Excel, Sven