A Technical Viewpoint

Protocol

Introduction

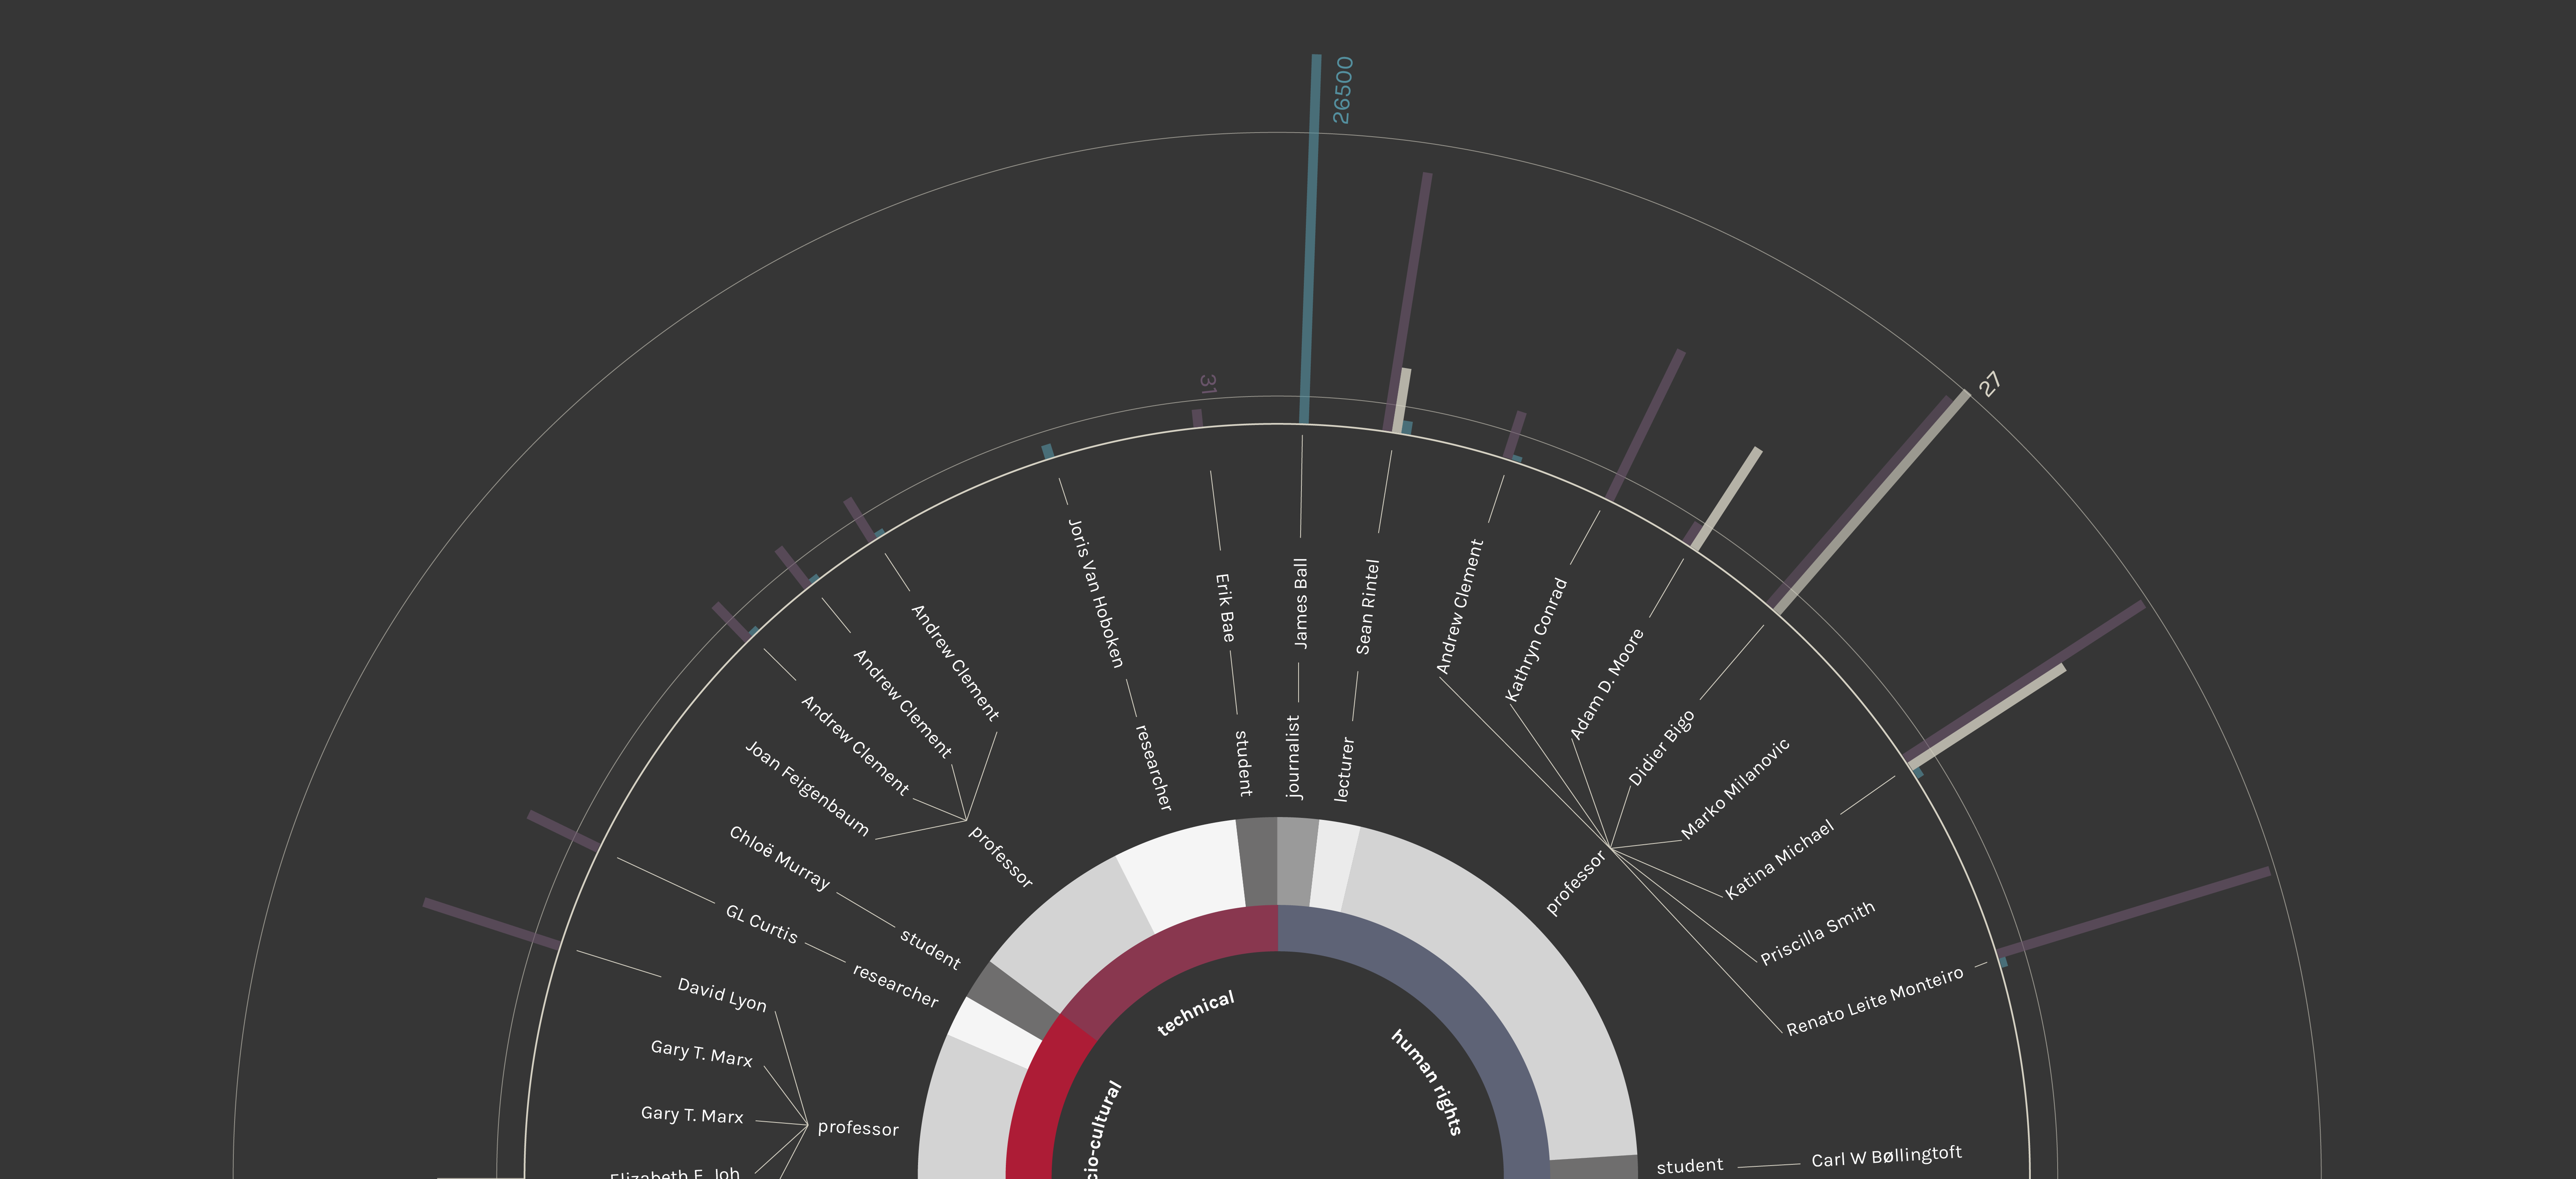
The third chapter focuses on how the debate in the academic world is developing. As in the second resarch step, those who debate on electronic mass surveillance on the web are journalists and academics. To have a more technical and deeper idea about the debate the academic world has been studied. It is interesting to look at the main topic from a technical and expert point of view. The speakers, as shown in the next chapters, have different skills and comes from different field of studies. This chapter mainly concerns in three parts, starting from a general overview of the speakers to a deep analysis of the relations among them and the other actors. The main source is Google Scholar, from which the papers and articles were taken into account. Five queries were used, quite similar to the ones used for the second step (chapter 02) but more specific, to collect results as pertinet to the issue as possible.
Step 1

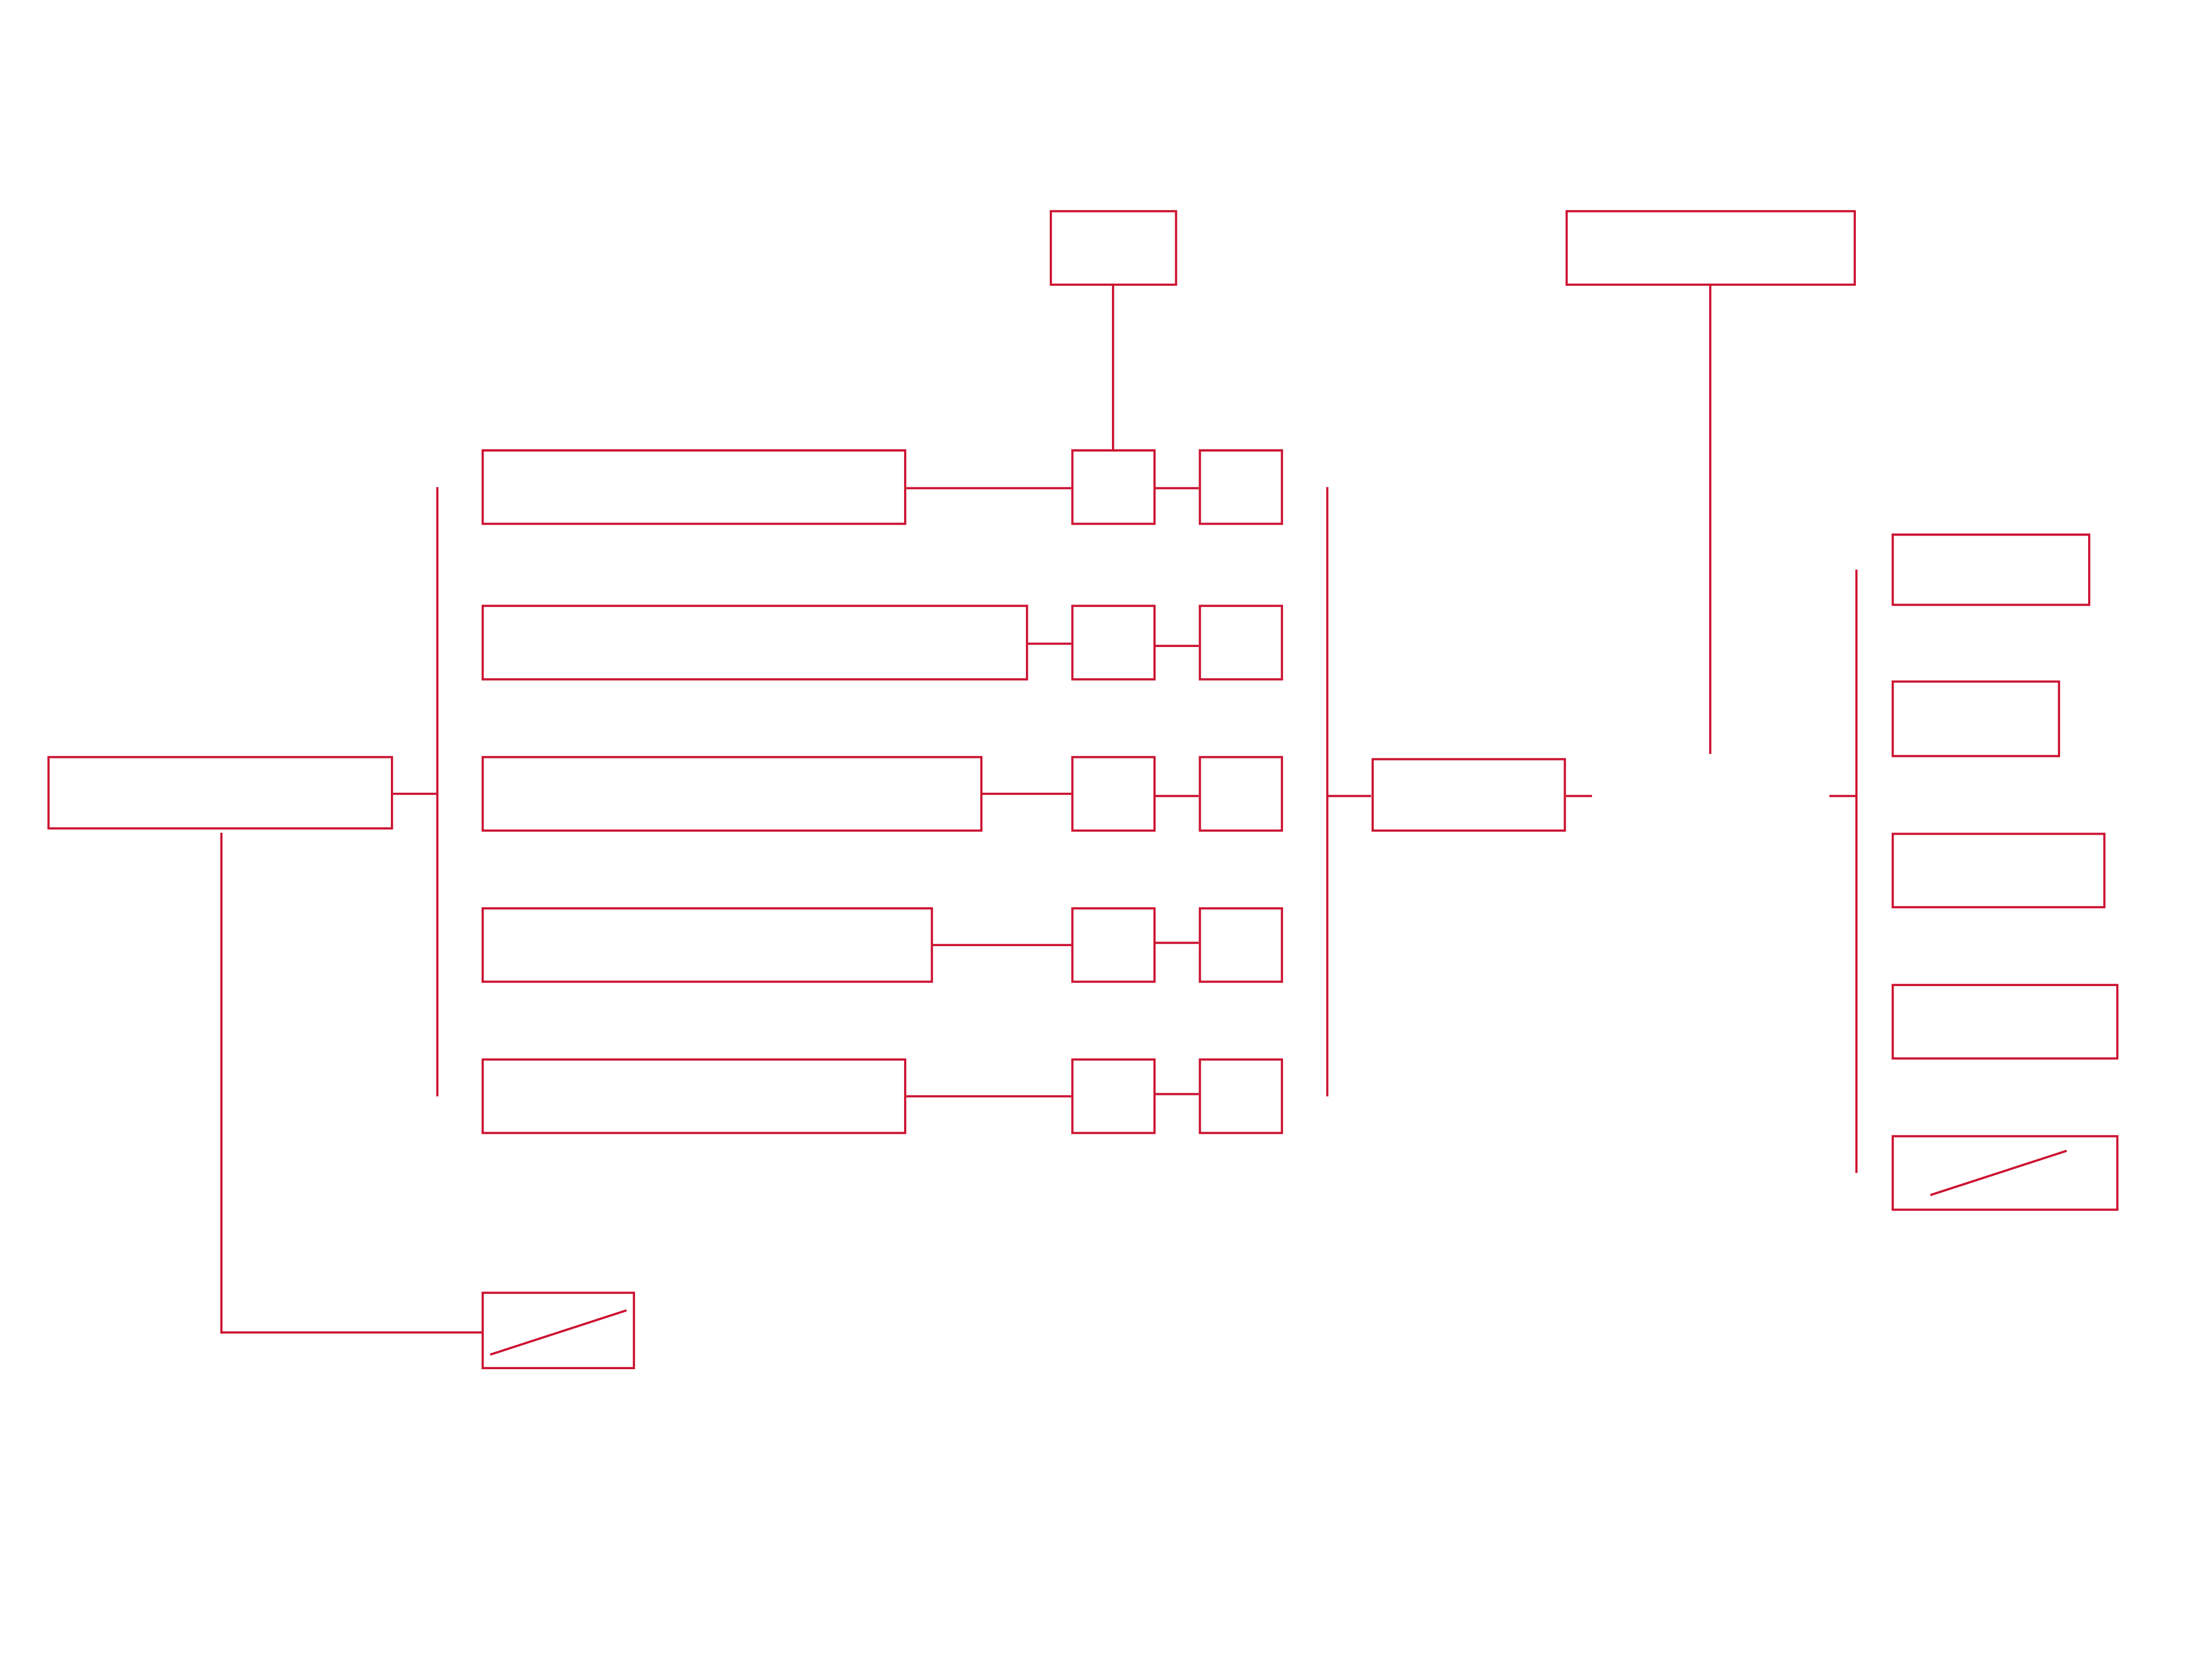
Queries:

-sigint+"mass surveillance"

-privacy+"mass surveillance

-"nothing to hide"+"mass surveillance"

-warrantless+"mass surveillance"

-tech giant "mass surveillance"

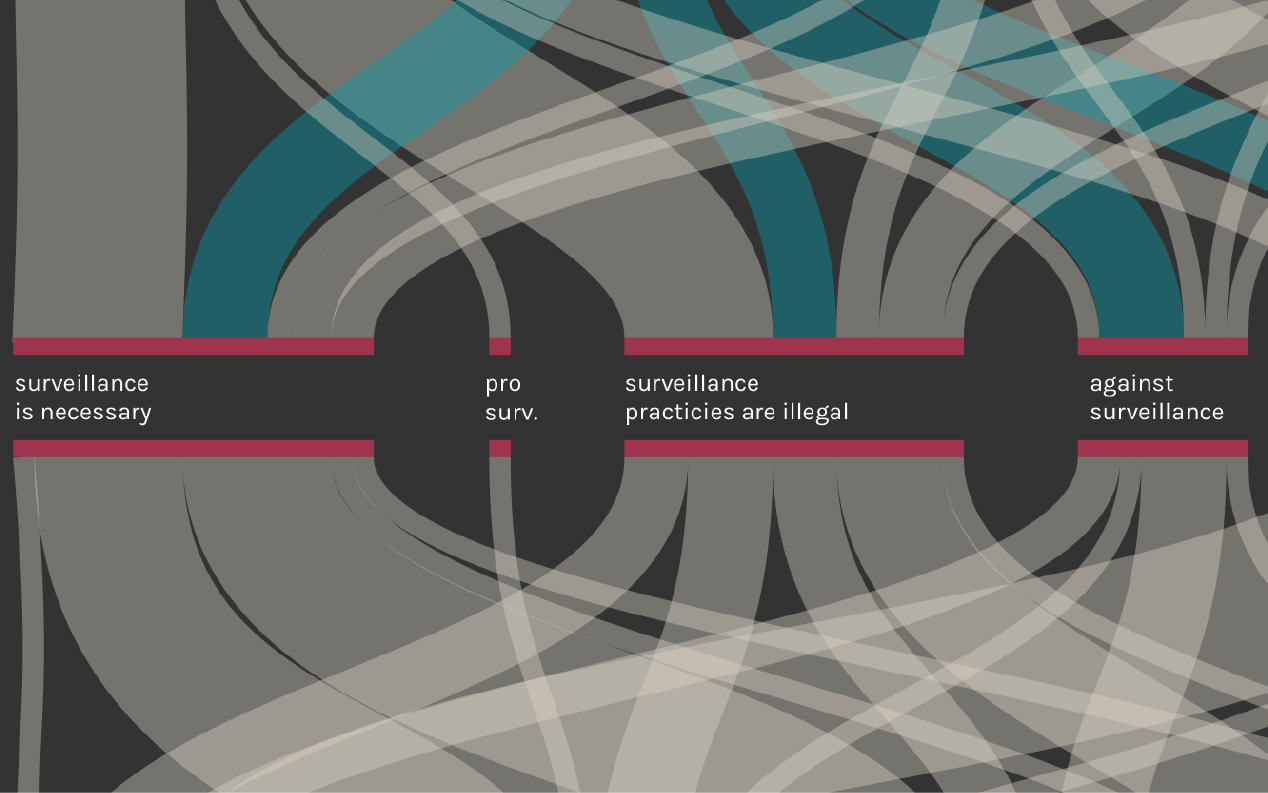
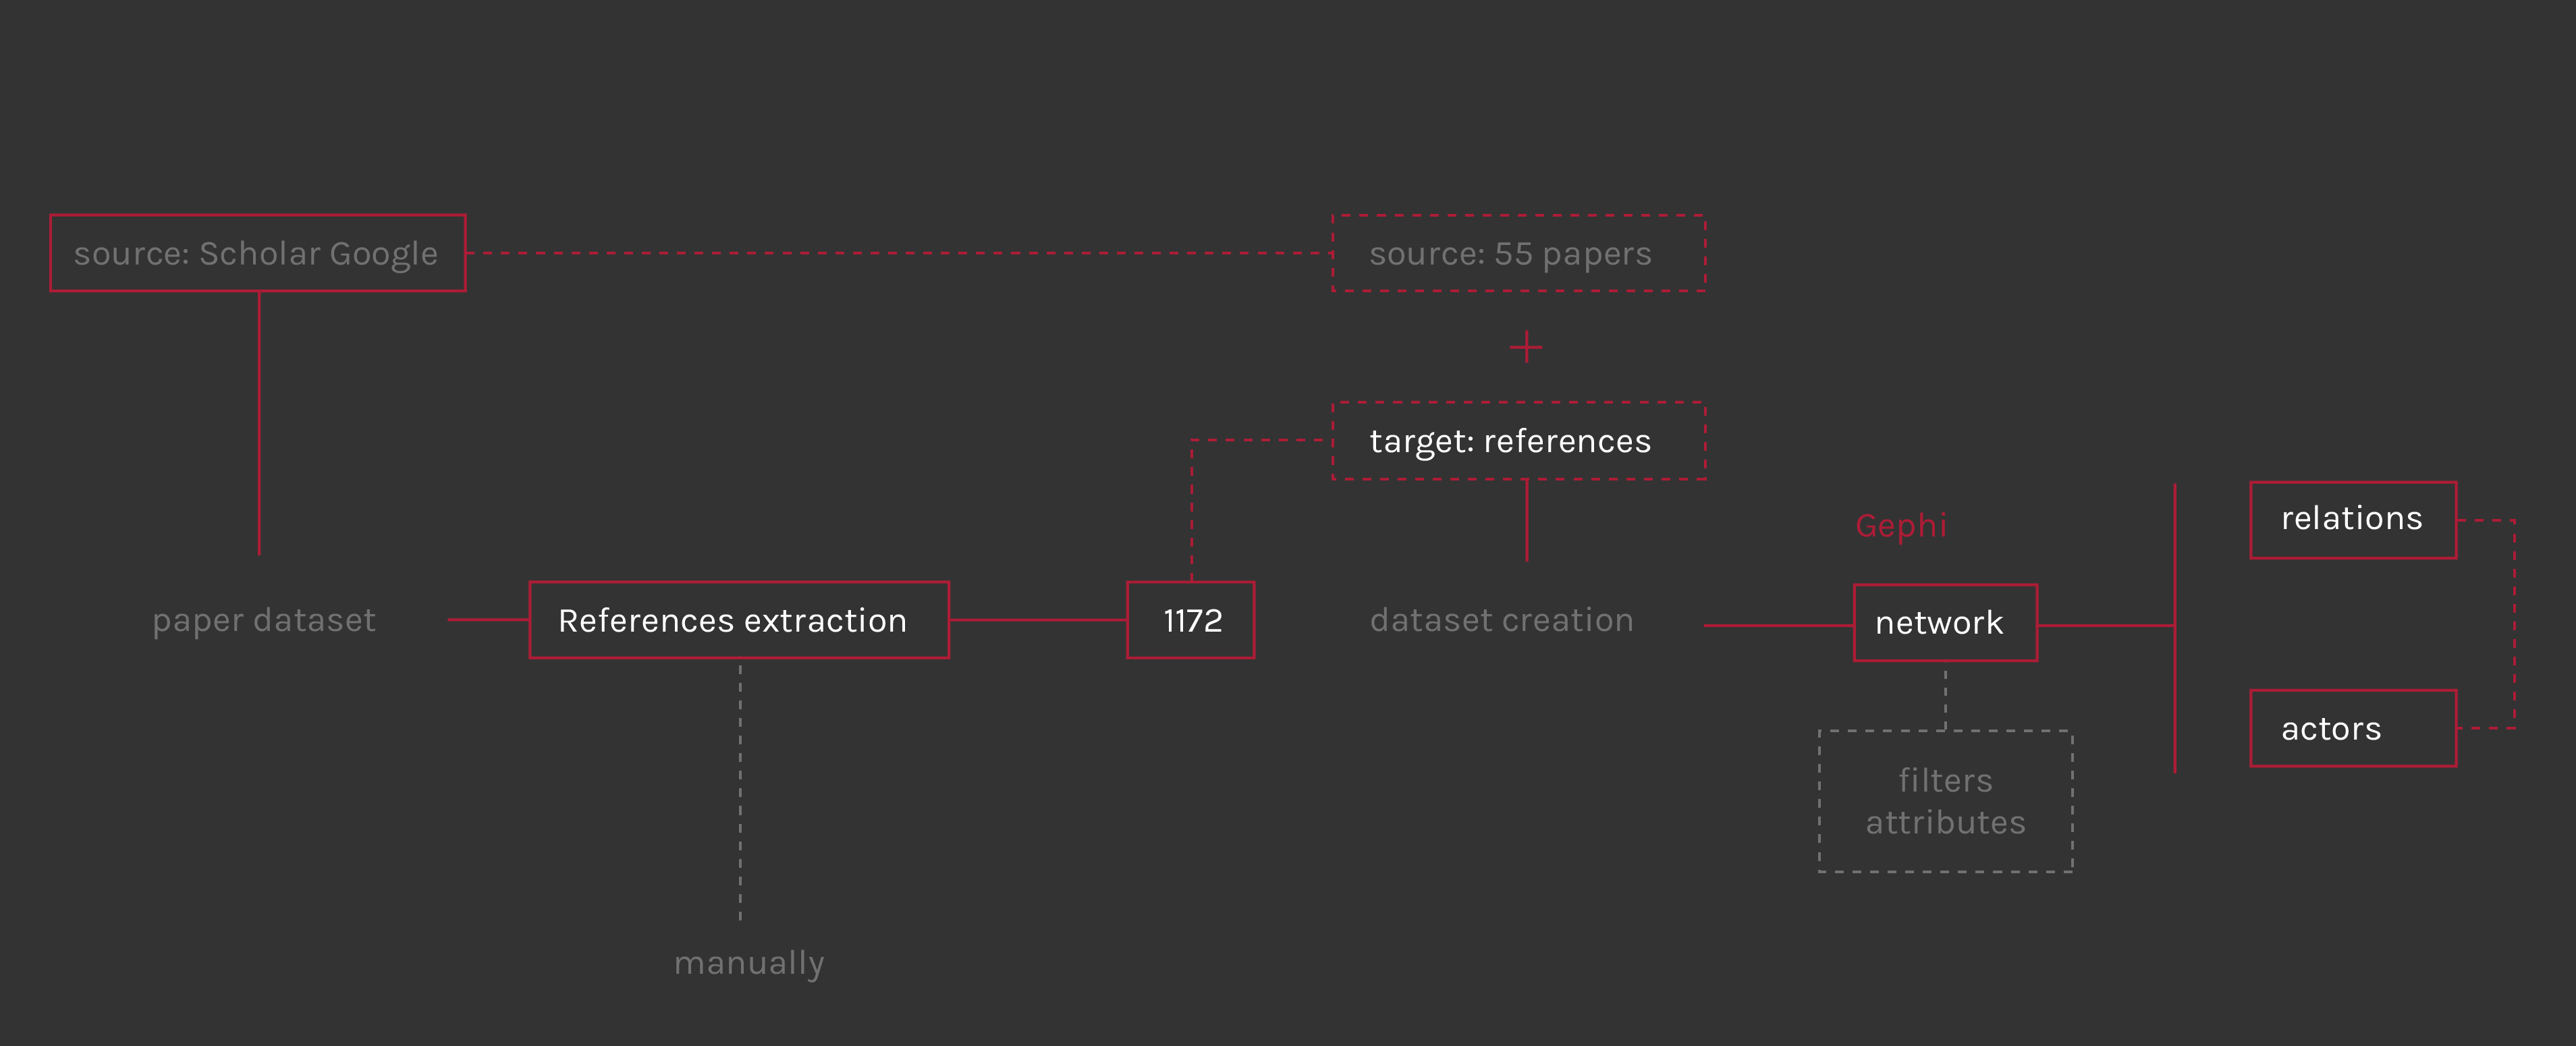
For each query the first two pages of the Google Scholar results were considered (40 links). First of whole KimonoLabs were used to extract some elements like the titles, links, dates and name of the authors. In a second step all the papers collected (200) have been opened to verify their relevance to the main research query. 55 papers were selected, downloaded, analyzed and tagged. The main dataset is composed by: id, link, title of the paper, author/s, information about the author (job, studies, nationality and university), viewpoint on the topic, actors and possible solution the speaker gives to the debate.

Informations about the relevance of the speakers on the social media were added: "h-index" and "cited" from Scholar Google profiles and numbers of the followers on Twitter and Linkedin. Google Refine was used to make the dataset more uniform after giving the tags. Specific dataset for visualization were created from the main one.

Step 2

References

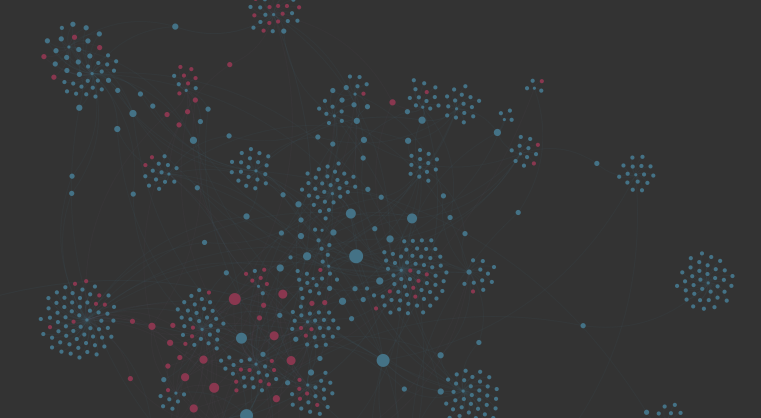
The second phase of this analysis consist in extracting references from the 55 academic papers, to see if and how they link each other and if there are recurring quoted authors and which are the main actors. The different papers structures does not allow to use a tool for automate this process, so the dataset has been created manually. The result was 1172 citations, that must be organized in a table with source column (papers) and target one (references). In this way the csv file is ready for being opened in Gephi. This time the cluster research has been done previously, defining two macro-categories: authors and case law; for nodes color definition has been used Gephi Plugin Give color to nodes that needs the addition of a “color” column in Gephi Node Table.

Useless steps

1. After analyzing the speakers, actors, topics and viewpoints, the geographic coordinates of the universities were collected to map the places of the debate. Who speaks, where and how much. All these elements were mapped using CartoDB but no interesting relations were found. Most of the speakers emerging are from English-speaking countries or from the European Uninion.

2. Data about the university rank were also added from shangairanking. com and compared with the rank of the paper in the google page and the opinios. The best universities compares among the first results, and there are no interesting clusters.

Metadata

Timestamp:
09/12/2014 - 18/12/2014

Data source:
Google Scholar, Twitter, Linkedin

Tools:
Kimono, Google Refine, Gephi