Newspapers' API Analisys

Protocol

Introduction

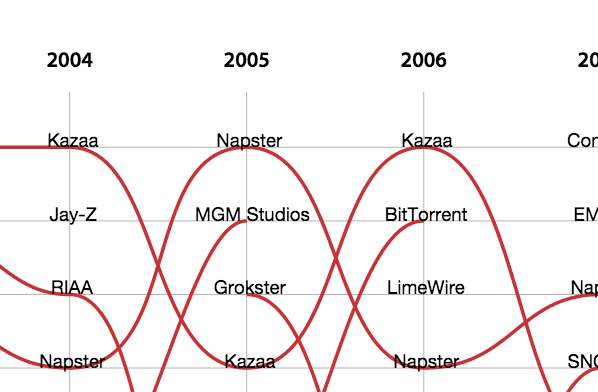
The graph shows a list with the 10 most discussed trends per year, from 2002 to 2014. These trends refer to th New York Times and The Guardian articles, and the trends are calculated by the amount of articles in which the query "File Sharing" is occurred.

Scraping

Request of an API Key for The Guardian API Explorer

Scraping of the first 500 "most-relevant" articles of the query "File Sharing" through API explorer, including fields:

  • Headline
  • Pub_date
  • Abstract

Organization of the Json files into Excel files with Open Refine

Text extraction, from the results with Zup, and cleaning of not pertinent articles.

Entities extraction

Removed every line break from the text file with Terminal

Creation of an Excel file with:

  • Column 1: Article Headline
  • Column 2: Pub_date
  • Column 3: Article Text

Upload of the dataset into Open Refine and extracted the entities with DataTXT (filter: 0.6)

Assigned "Article Headline" and "Pub_date" to the empty rows (DataTXT adds each new value into a new row)


Process repeated for New York Times articles

Finalization of the visualization

Created an Excel with the sum of the NYTimes and TheGuardian Articles and organized entities by year into a Pivot table

Cleaning of the irrelevant results

Selection of the 10 most important trends

Metadata

Timestamp:
16/12/2014

Data source:
New York Times, The Guardian

Tools:
DataTXT, Open Refine, Named Entity Recognition Plugin, Zup, Excel