Introduction
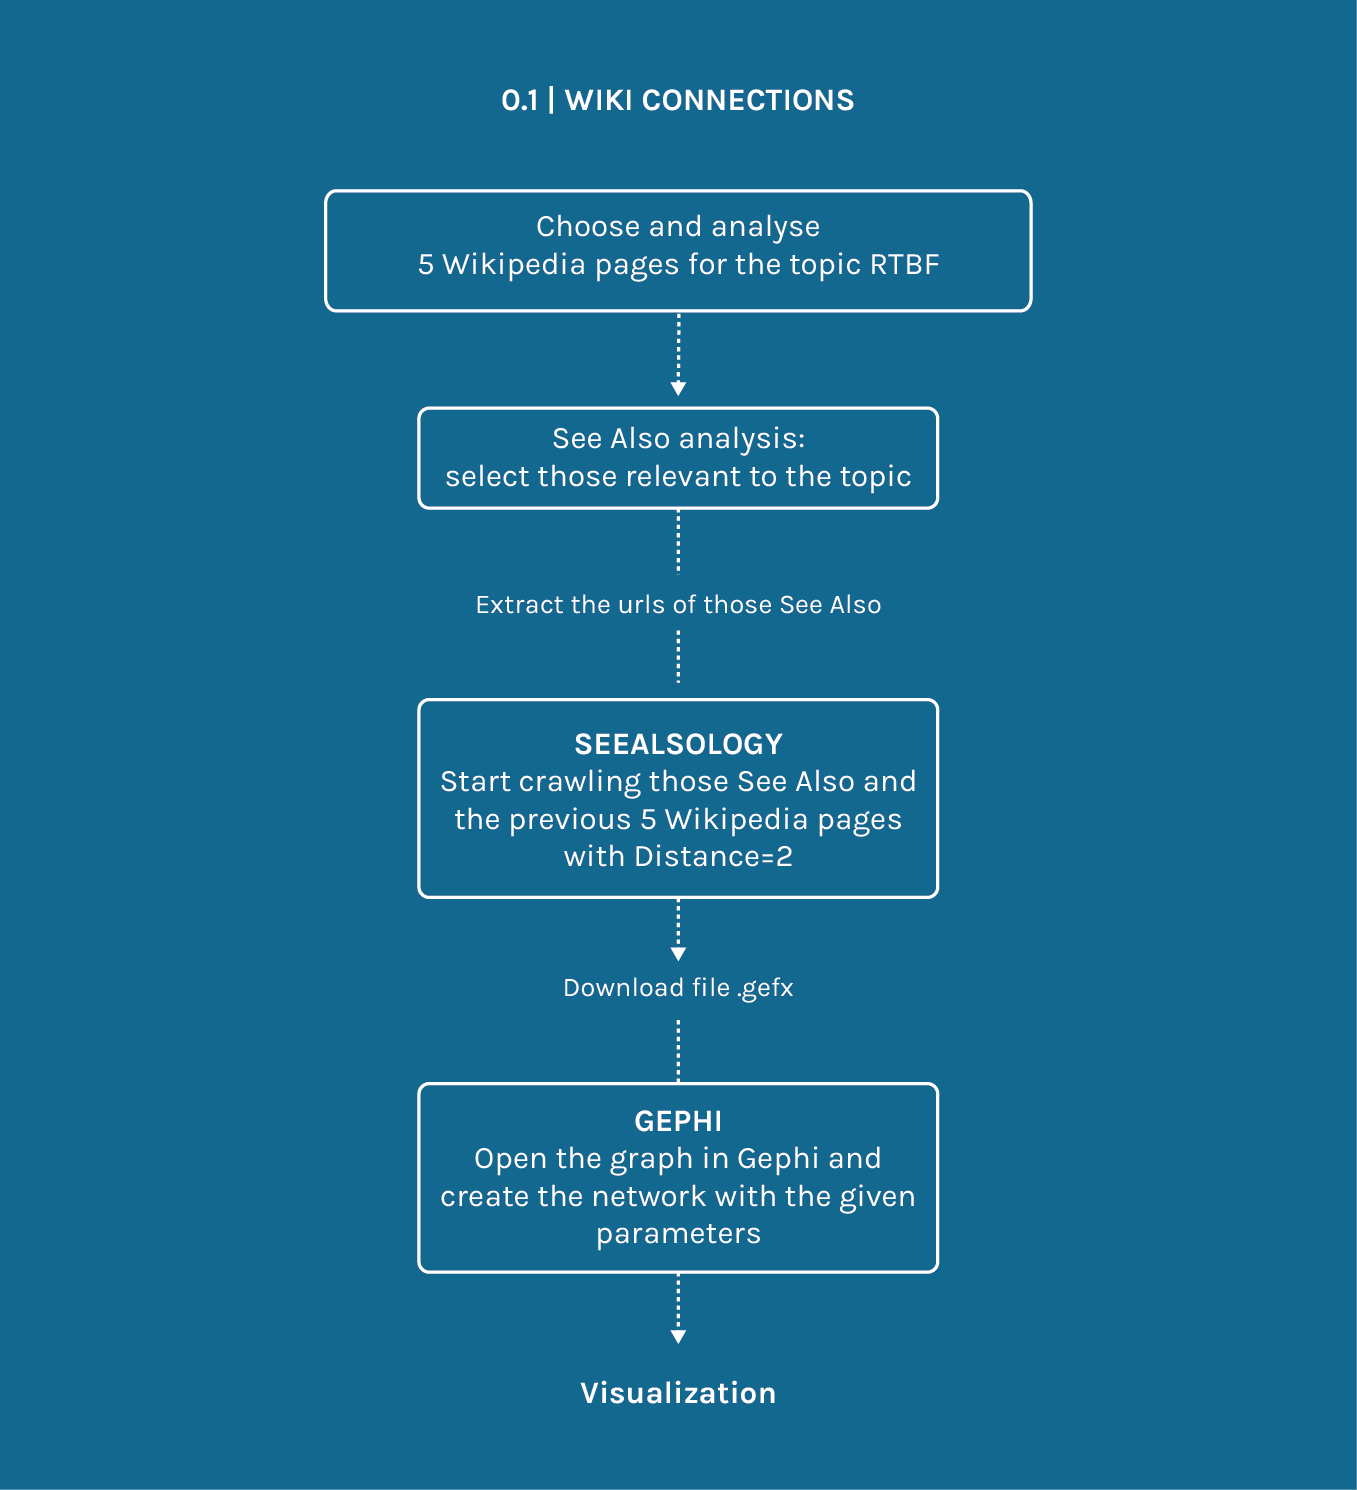
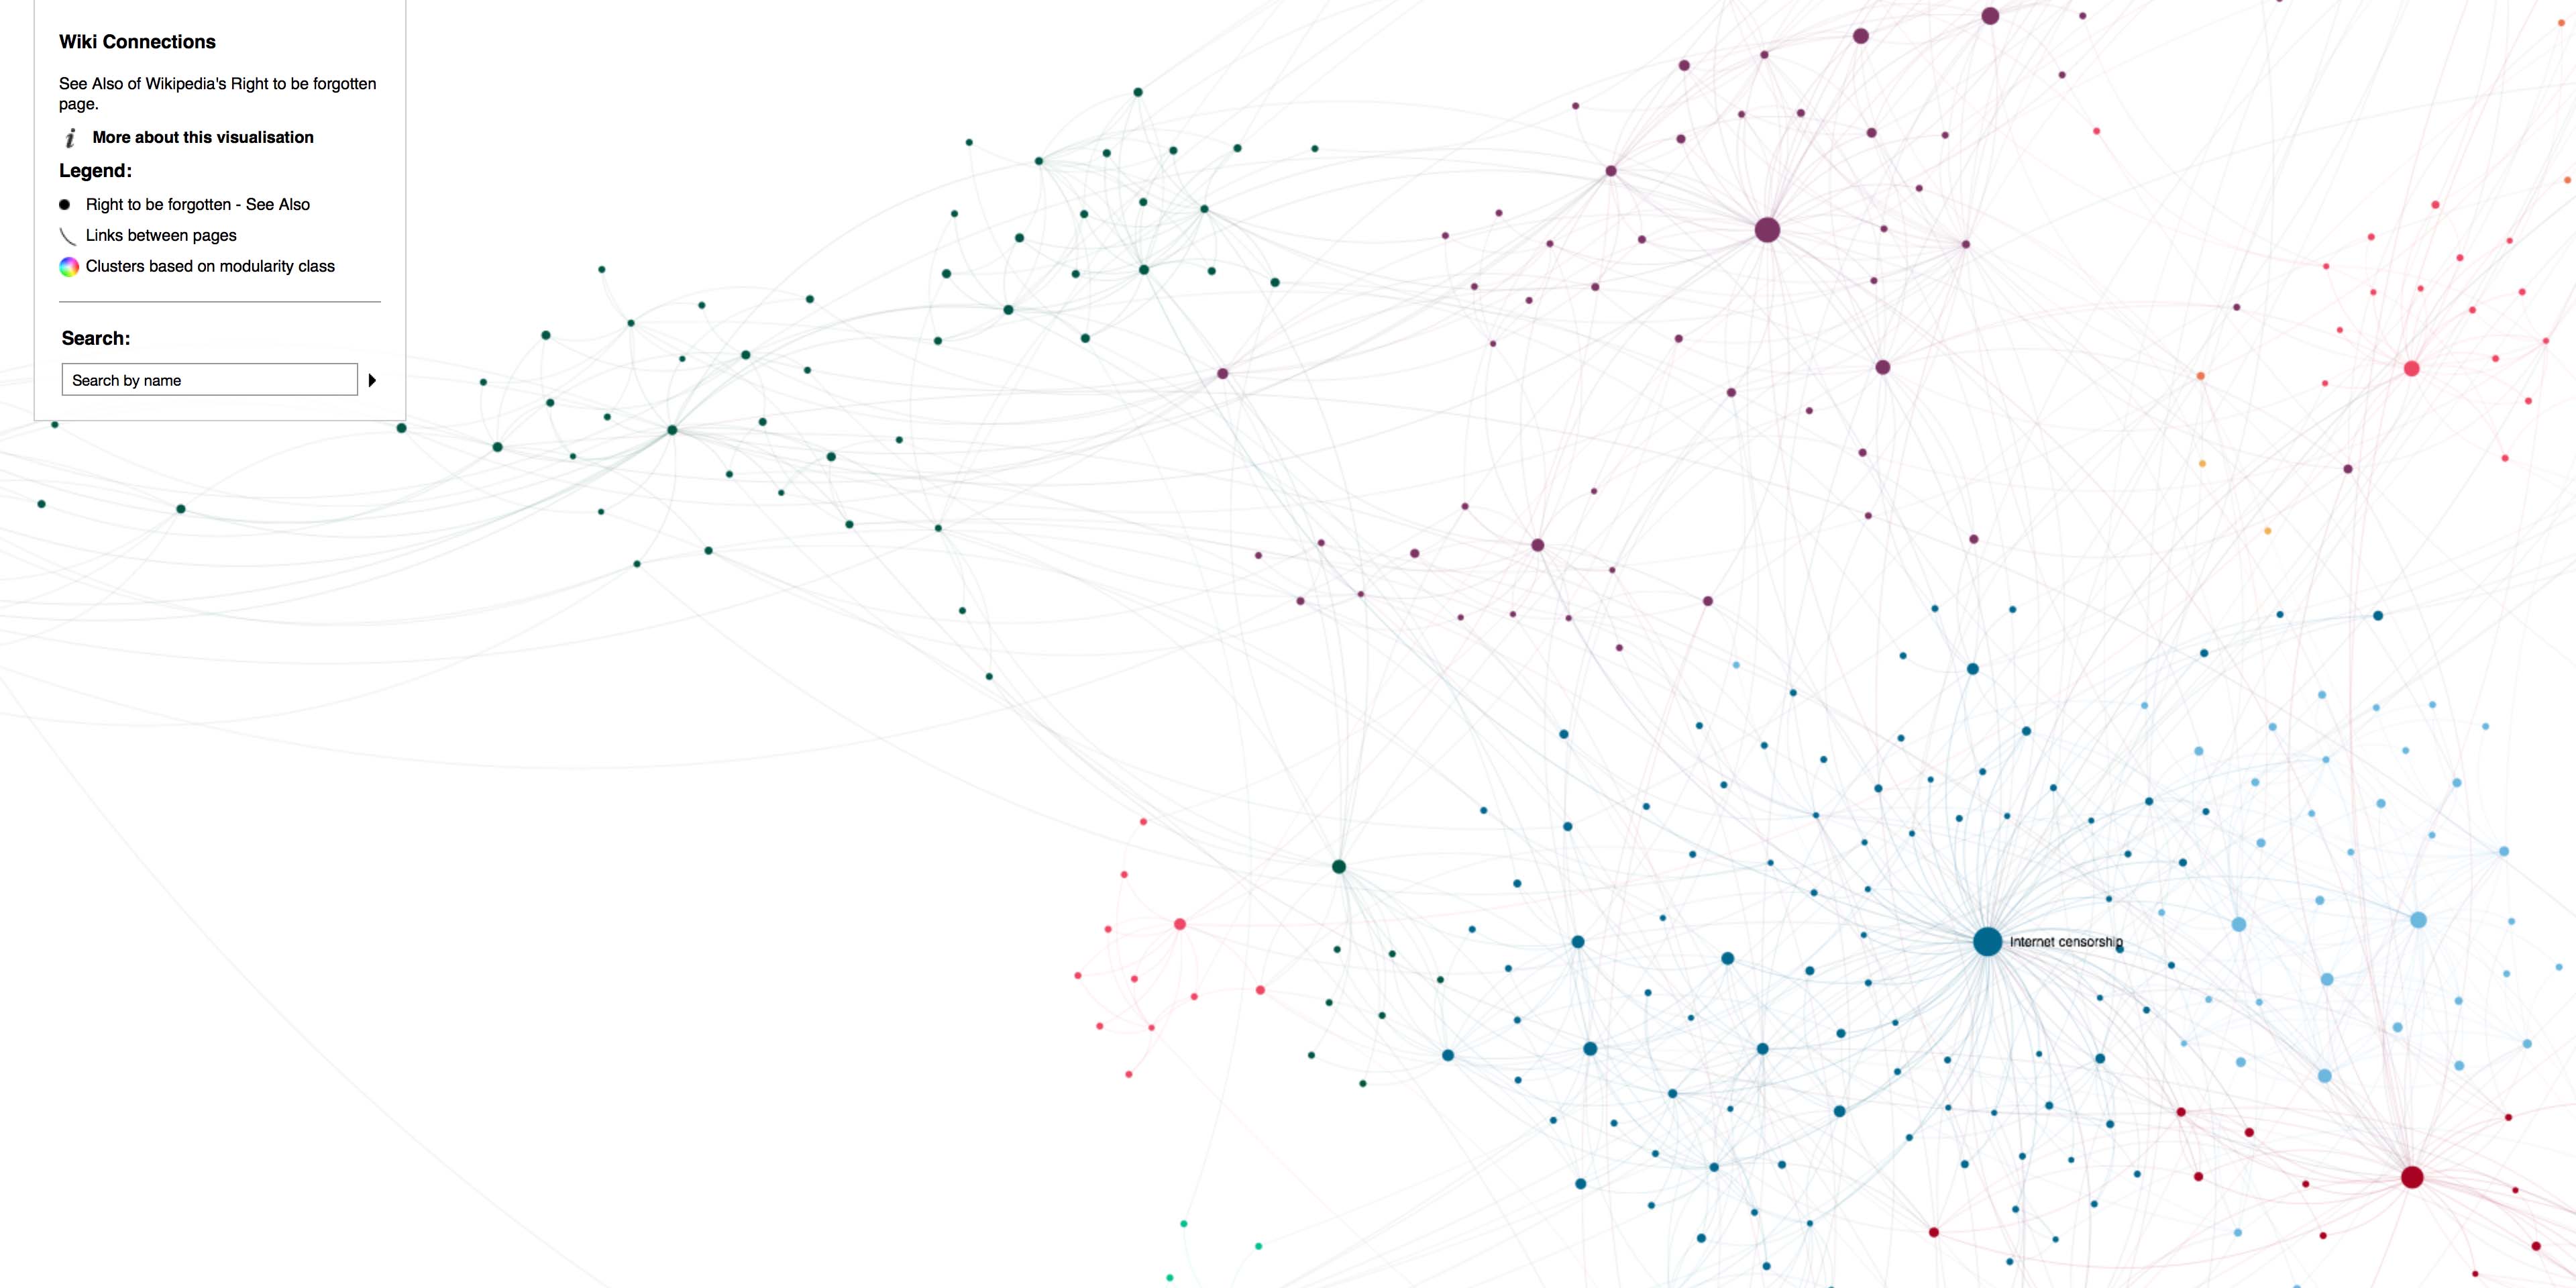
In order to explore the semantic area related to those selected Wikipedia pages about the Right to be forgotten, we used Seealsology tool, which allowed us to extract all the links in the See Also section producing a graph.
In order to explore the semantic area related to those selected Wikipedia pages about the Right to be forgotten, we used Seealsology tool, which allowed us to extract all the links in the See Also section producing a graph.
After selecting 5 Wikipedia pages linked to the topic of the research, extract the See Also urls from each of these 5 pages: on your wikipedia page, right click and select Explore Element, copy the div where the See Also are and then paste it on extractlinkurl.com. Then click on Extract all urls. In order to pinpoint the topic, read the See Also and highlight those that are actually inherent to it. Then, on Seealsology (labs.densitydesign.org/seealsology) put the urls of the 5 initial pages and of the See Also highlighted as relevant so that you can begin to explore the topic in a visual way. Put Distance=2 and start crawling (do not do anything else during the process so that it doesn’t freeze): by putting Distance=2 you are able to collect all the See Also (starting from your pages) up to 2 levels. If you put a higher distance, once you are able to import the graph in Gephi, you would get an almost incomprehensible graph, very dense and with up to 9000 nodes, making it really difficult to read. Once you have downloaded the .gefx file, open it in Gephi, selecting Graph Type: Directed, then you should put the following parameters: