Introduction
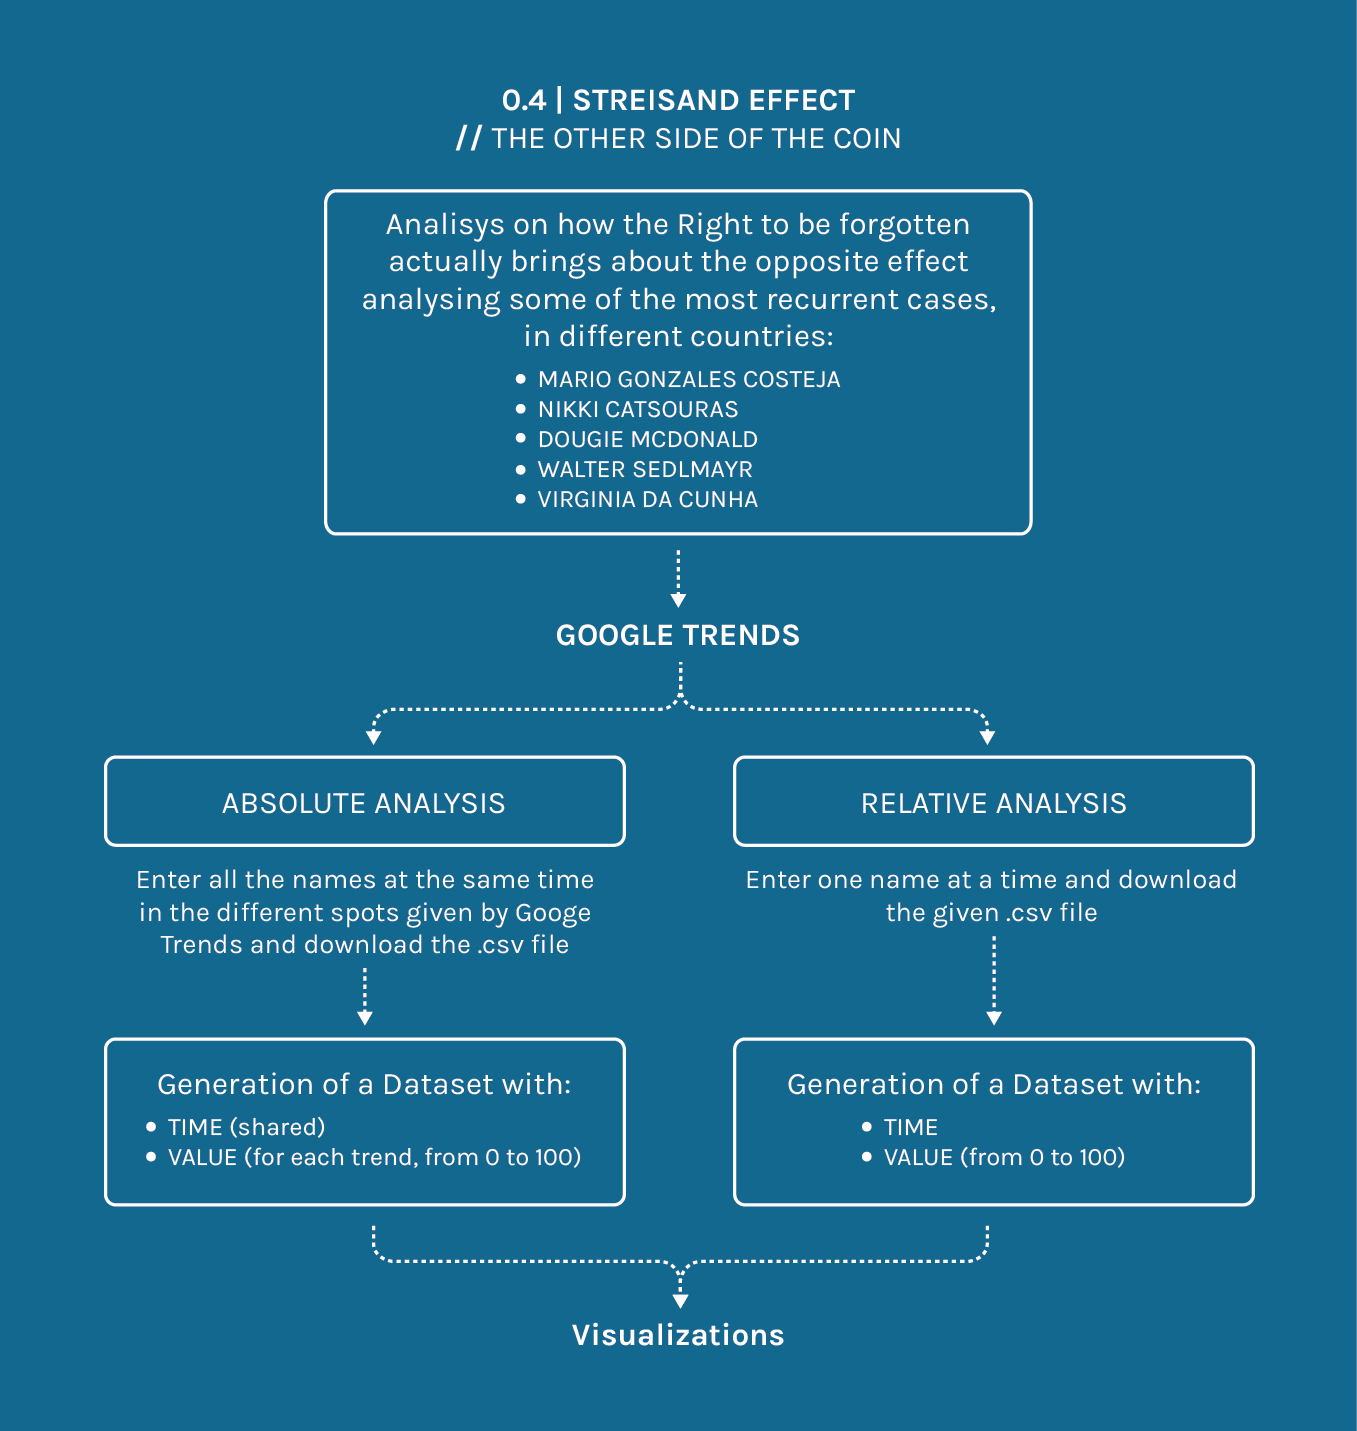
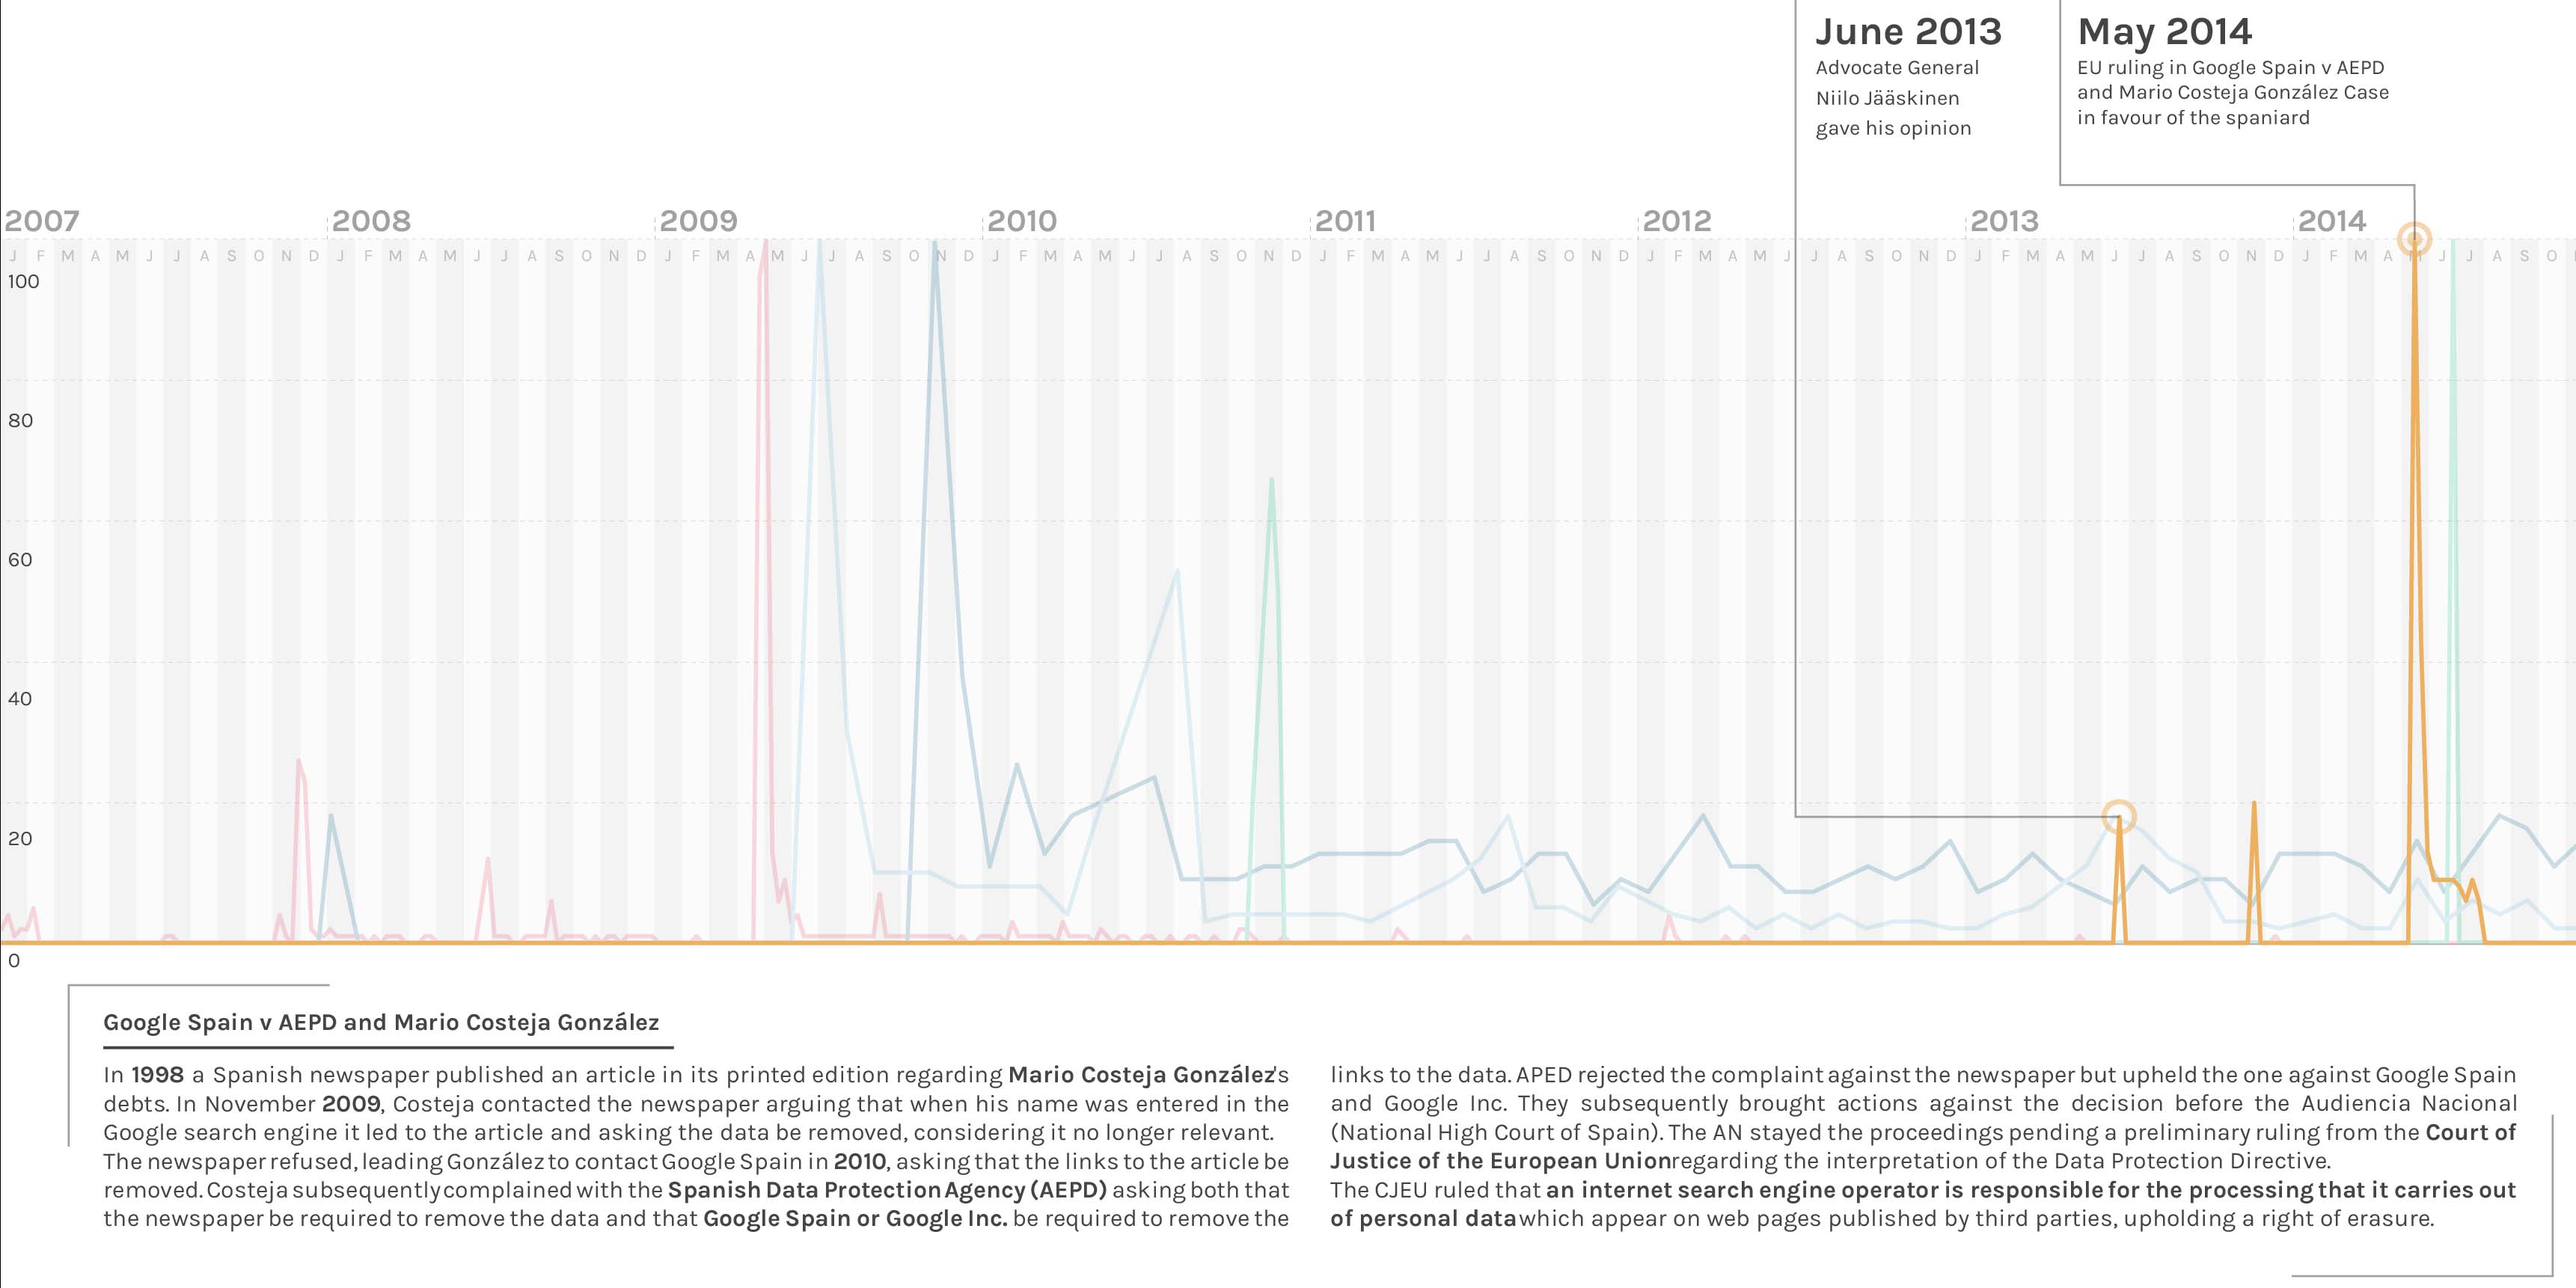
For the first visualization, namely “The other side of the coin” in order to verify if the so called “Streisand Effect” actually happened, we used the tool Google Trends. Thanks to it we were able to visualize either the single trends or them altogether.
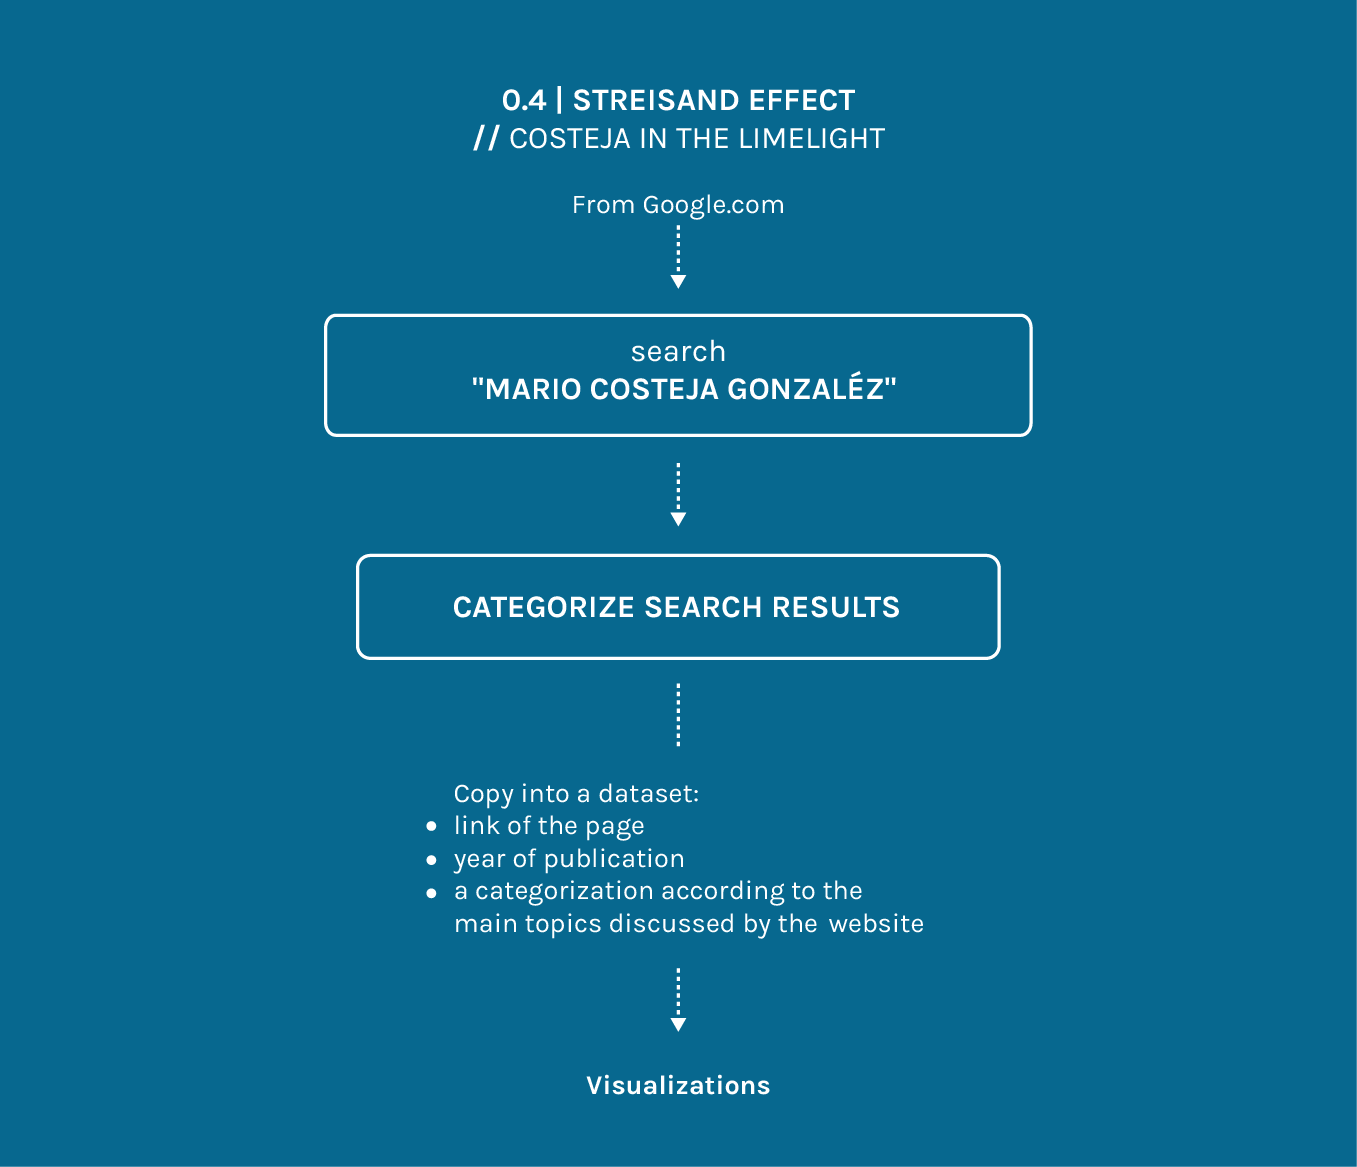
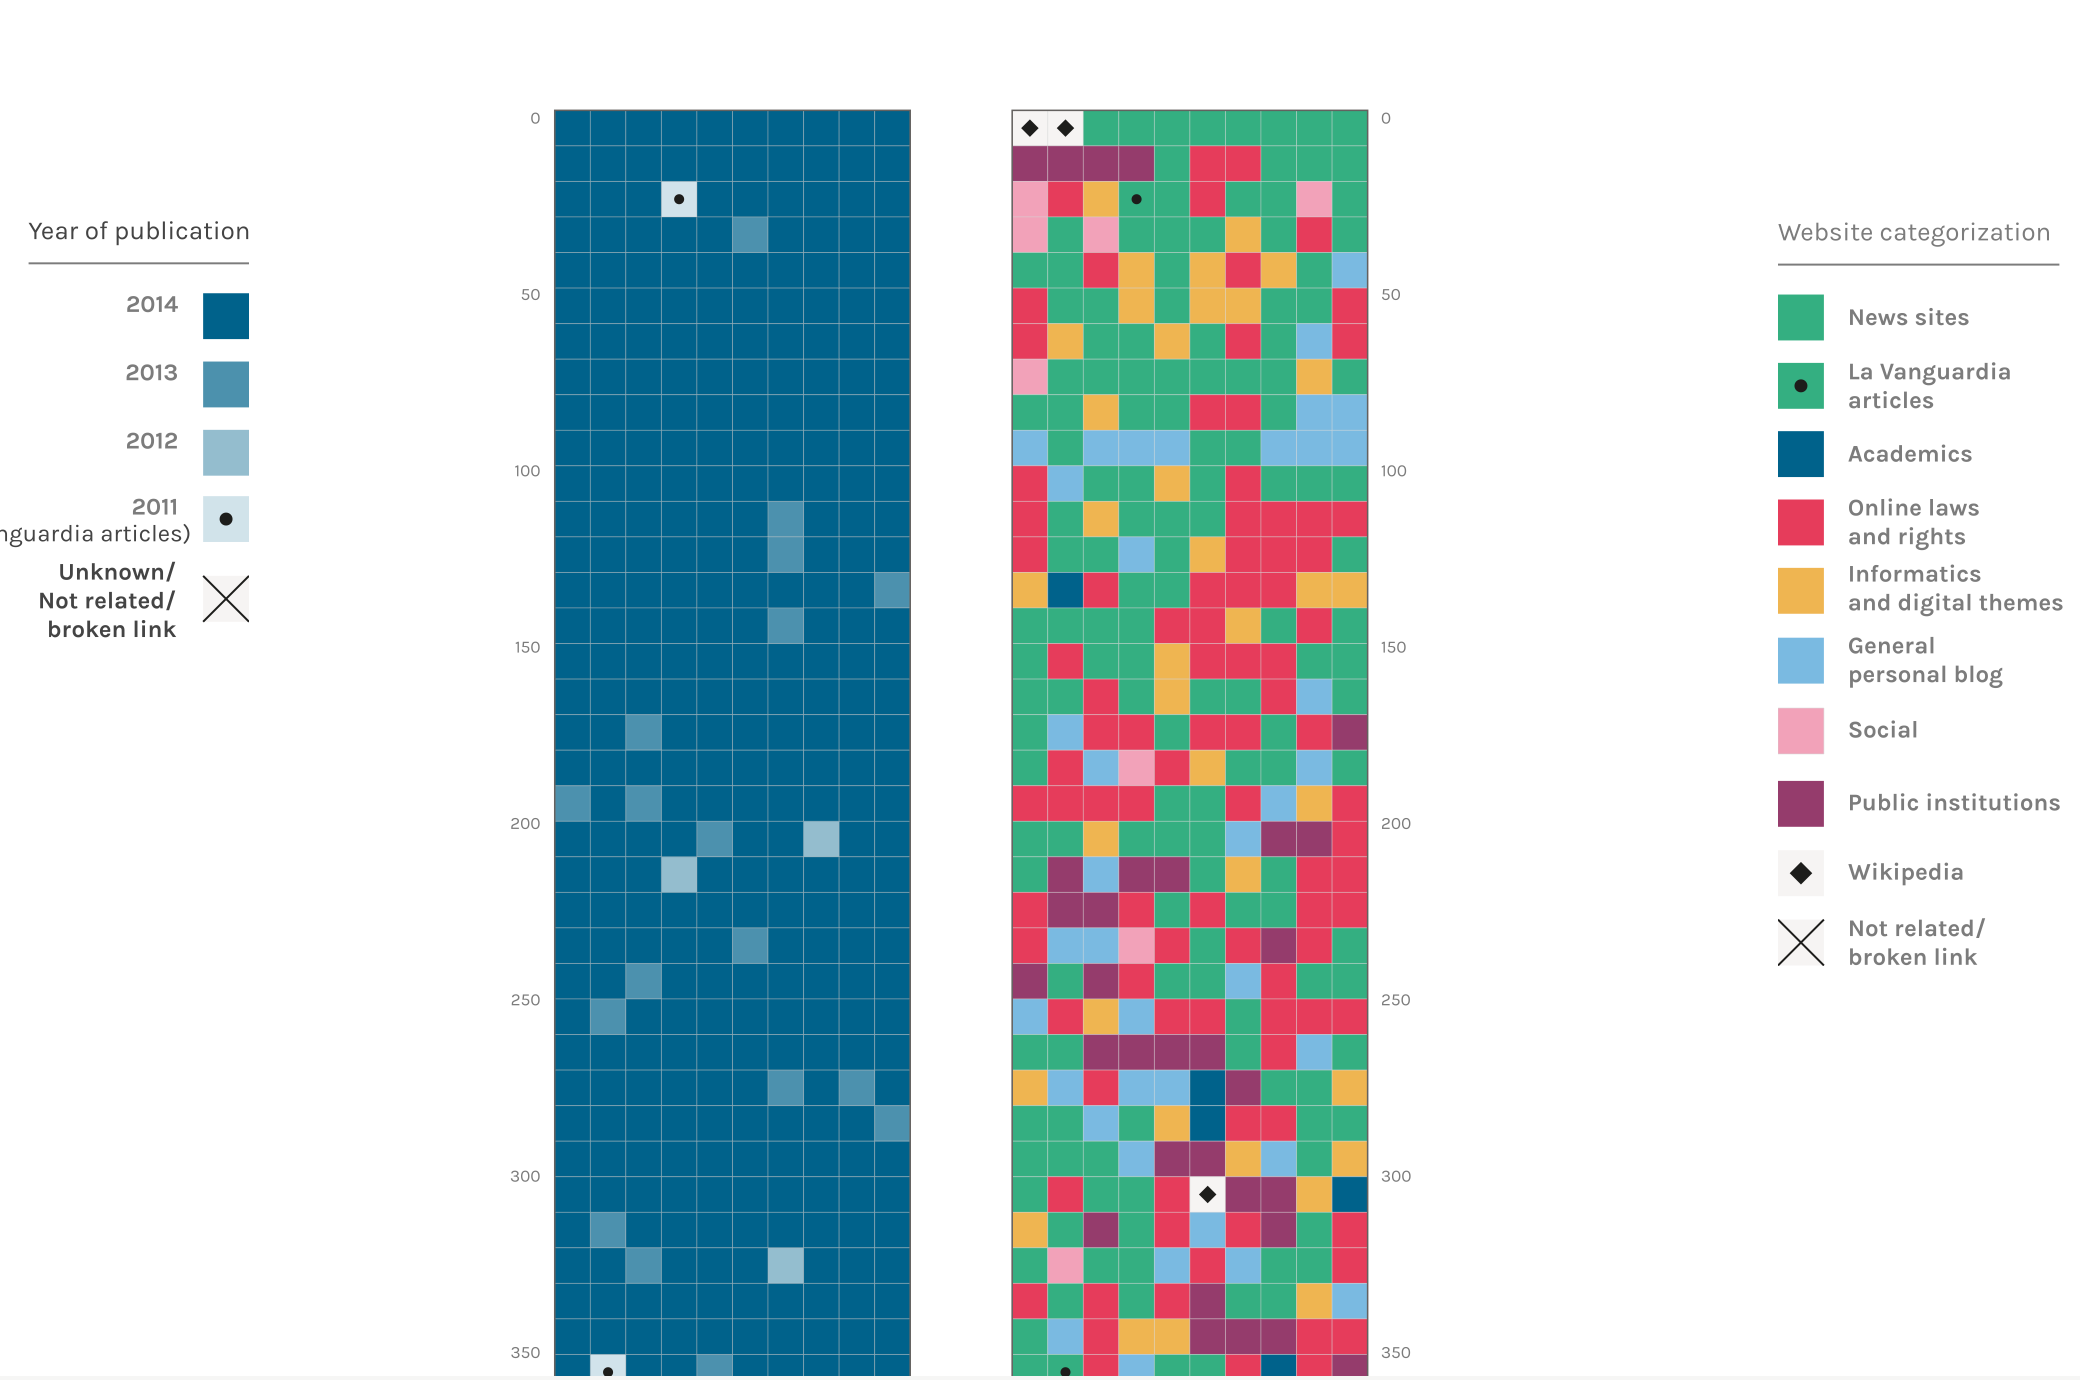
For the second visualization, the one called “Costeja in the limelight” we analysed each and every single result given by Google once we entered the query “Mario Gonzales Costeja”. We then were able to order them by year or by type of result, in order to get a full overview of how much and in what way the web talks about him.


