Description
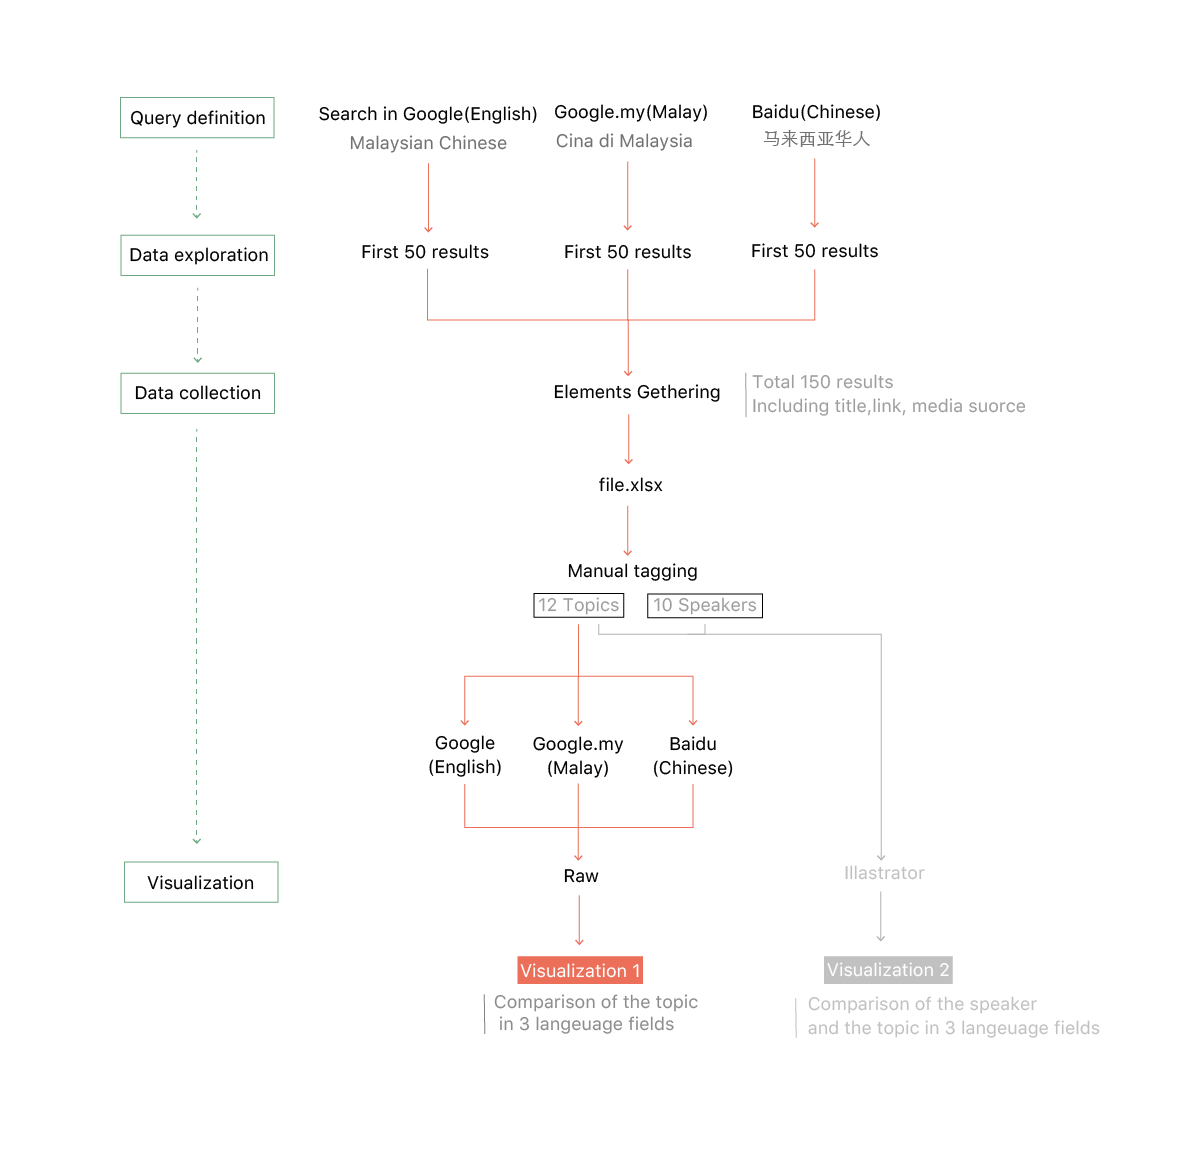
We found that Malaysian Chinese is not related to Bumiputera (native in Malaysia) in Wikipedia, so we wanted to know what the topics being talked more are about Malaysian Chinese. To better understand different perspectives towards this ethnic group, we wanted to investigate it by using different languages in different searching engines. Looking for an answer to this question, the search took place on Google (in English), Google.my (in Malay), Baidu (in Chinese). With the queries “Malaysian Chinese” , “Cina di Malaysia” and “马来西亚华人” the search was conducted in the first 50 results in visitor mode, a total of 150 results.
We used three treemaps (hierarchy oriented) to visualize it. It is a scale diagram of number of topics. The same color refers to the same topic. The bigger the squares are, more results are on the topics.
According to the comparison between three languages fields, we can see that “social status” is talked most in baidu, which even doesn’t appear in google.us;”politics” is talked most in google.my. In addition, “economy”is talked most in google.us, which is successively decremented in google.my and baidu. Meanwhile, baidu and google.my care more about “culture” than google.us. For “military”, the proportion in google.us and google.my is similar, but it is not mentioned in Baidu. “Language” is talked more in Google.us and baidu than google.my. What’s more, google.us and google.my care about “religion” more than baidu.
It can be seen that in google.us, the most interesting topic about Malaysian Chinese is “economy”. In baidu, “social status” and “culture” are important, while in google.my, “politics” is discussed most.
Protocol

To make the visualization, we collected 50 results from google.us in English, 50 results from google.my in Malay and 50 results from Baidu in Chinese. The 150 results were collected and divided into 12 categories manually in Excel: economy, politics, religion, language, culture, community connection, education, entertainment, general introduction, identity, military and others. Then we used Rawgraphs to create 3 charts in each language field to make comparison.