Description
In academic field, the third question we want to ask is that, is there any main speaker studies on which topic, and how is his/her influence?
Thus, the visualization concentrates on topics ,authors and their competences.
In the centre of the circle there are nine clusters representing the topics that the papers study on, the second circle towards the exterior shows the names of the authors. In the external ring each scholar is linked to a small histogram representing his/her influence in academic area which is h-index from the Google Scholar profile.
The aim of the visualization is to introduce the research on academic papers and show names and competences of scholars. We found that the topics that are discussed most are “identity”,then “politics” and “medical science”.What’s more, Regarding the influence of the authors, only in three fields there are authors (one of each) with high impact: identity, politics and medical science.
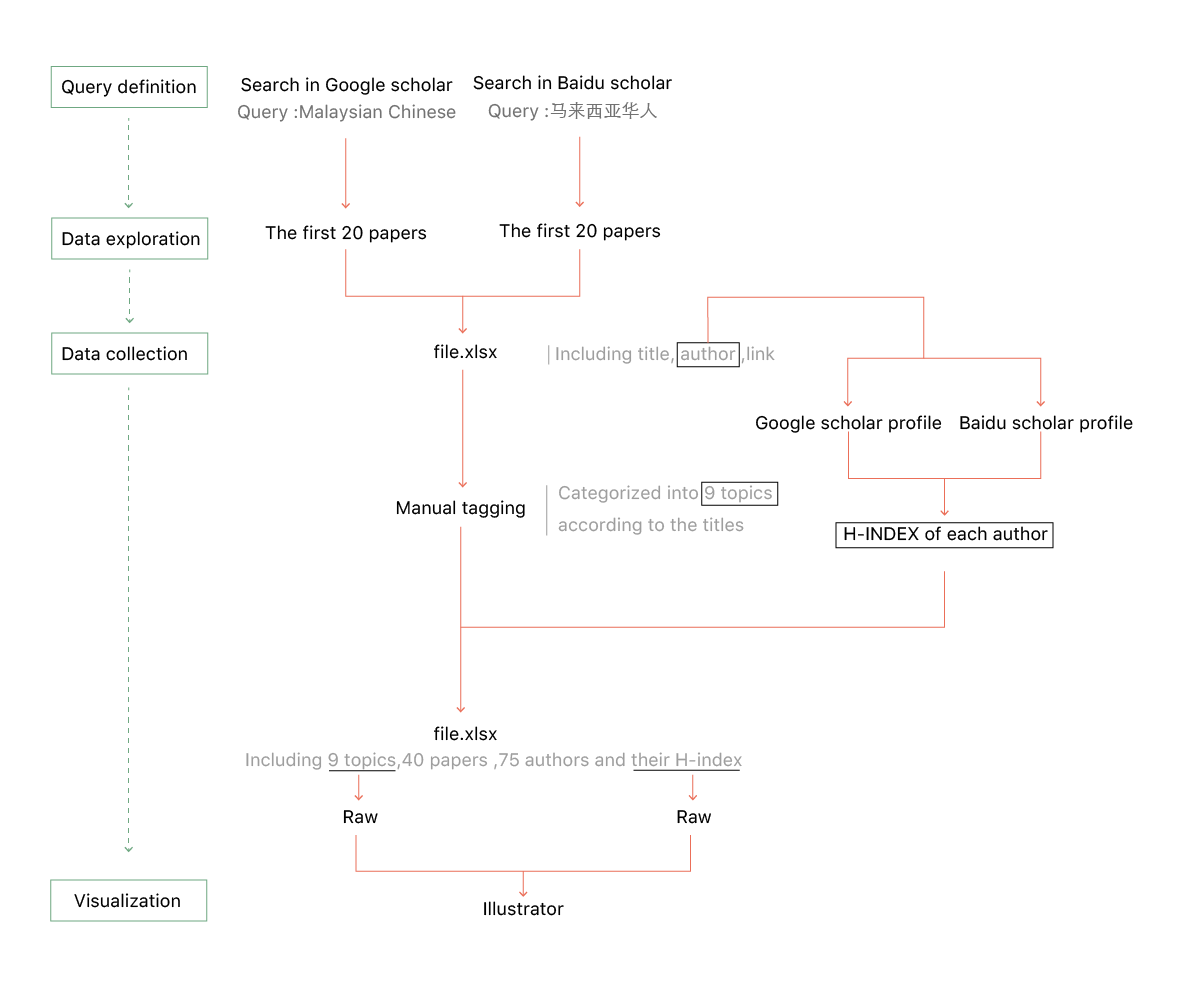
Protocol

The data of topics has been integrated with data from the Google Scholar profiles and Baidu scholar profiles, but not all the speakers have their own pages. Sunburst and bar chart were created using RAW and then we combined them together with Adobe Illustrator.