Description

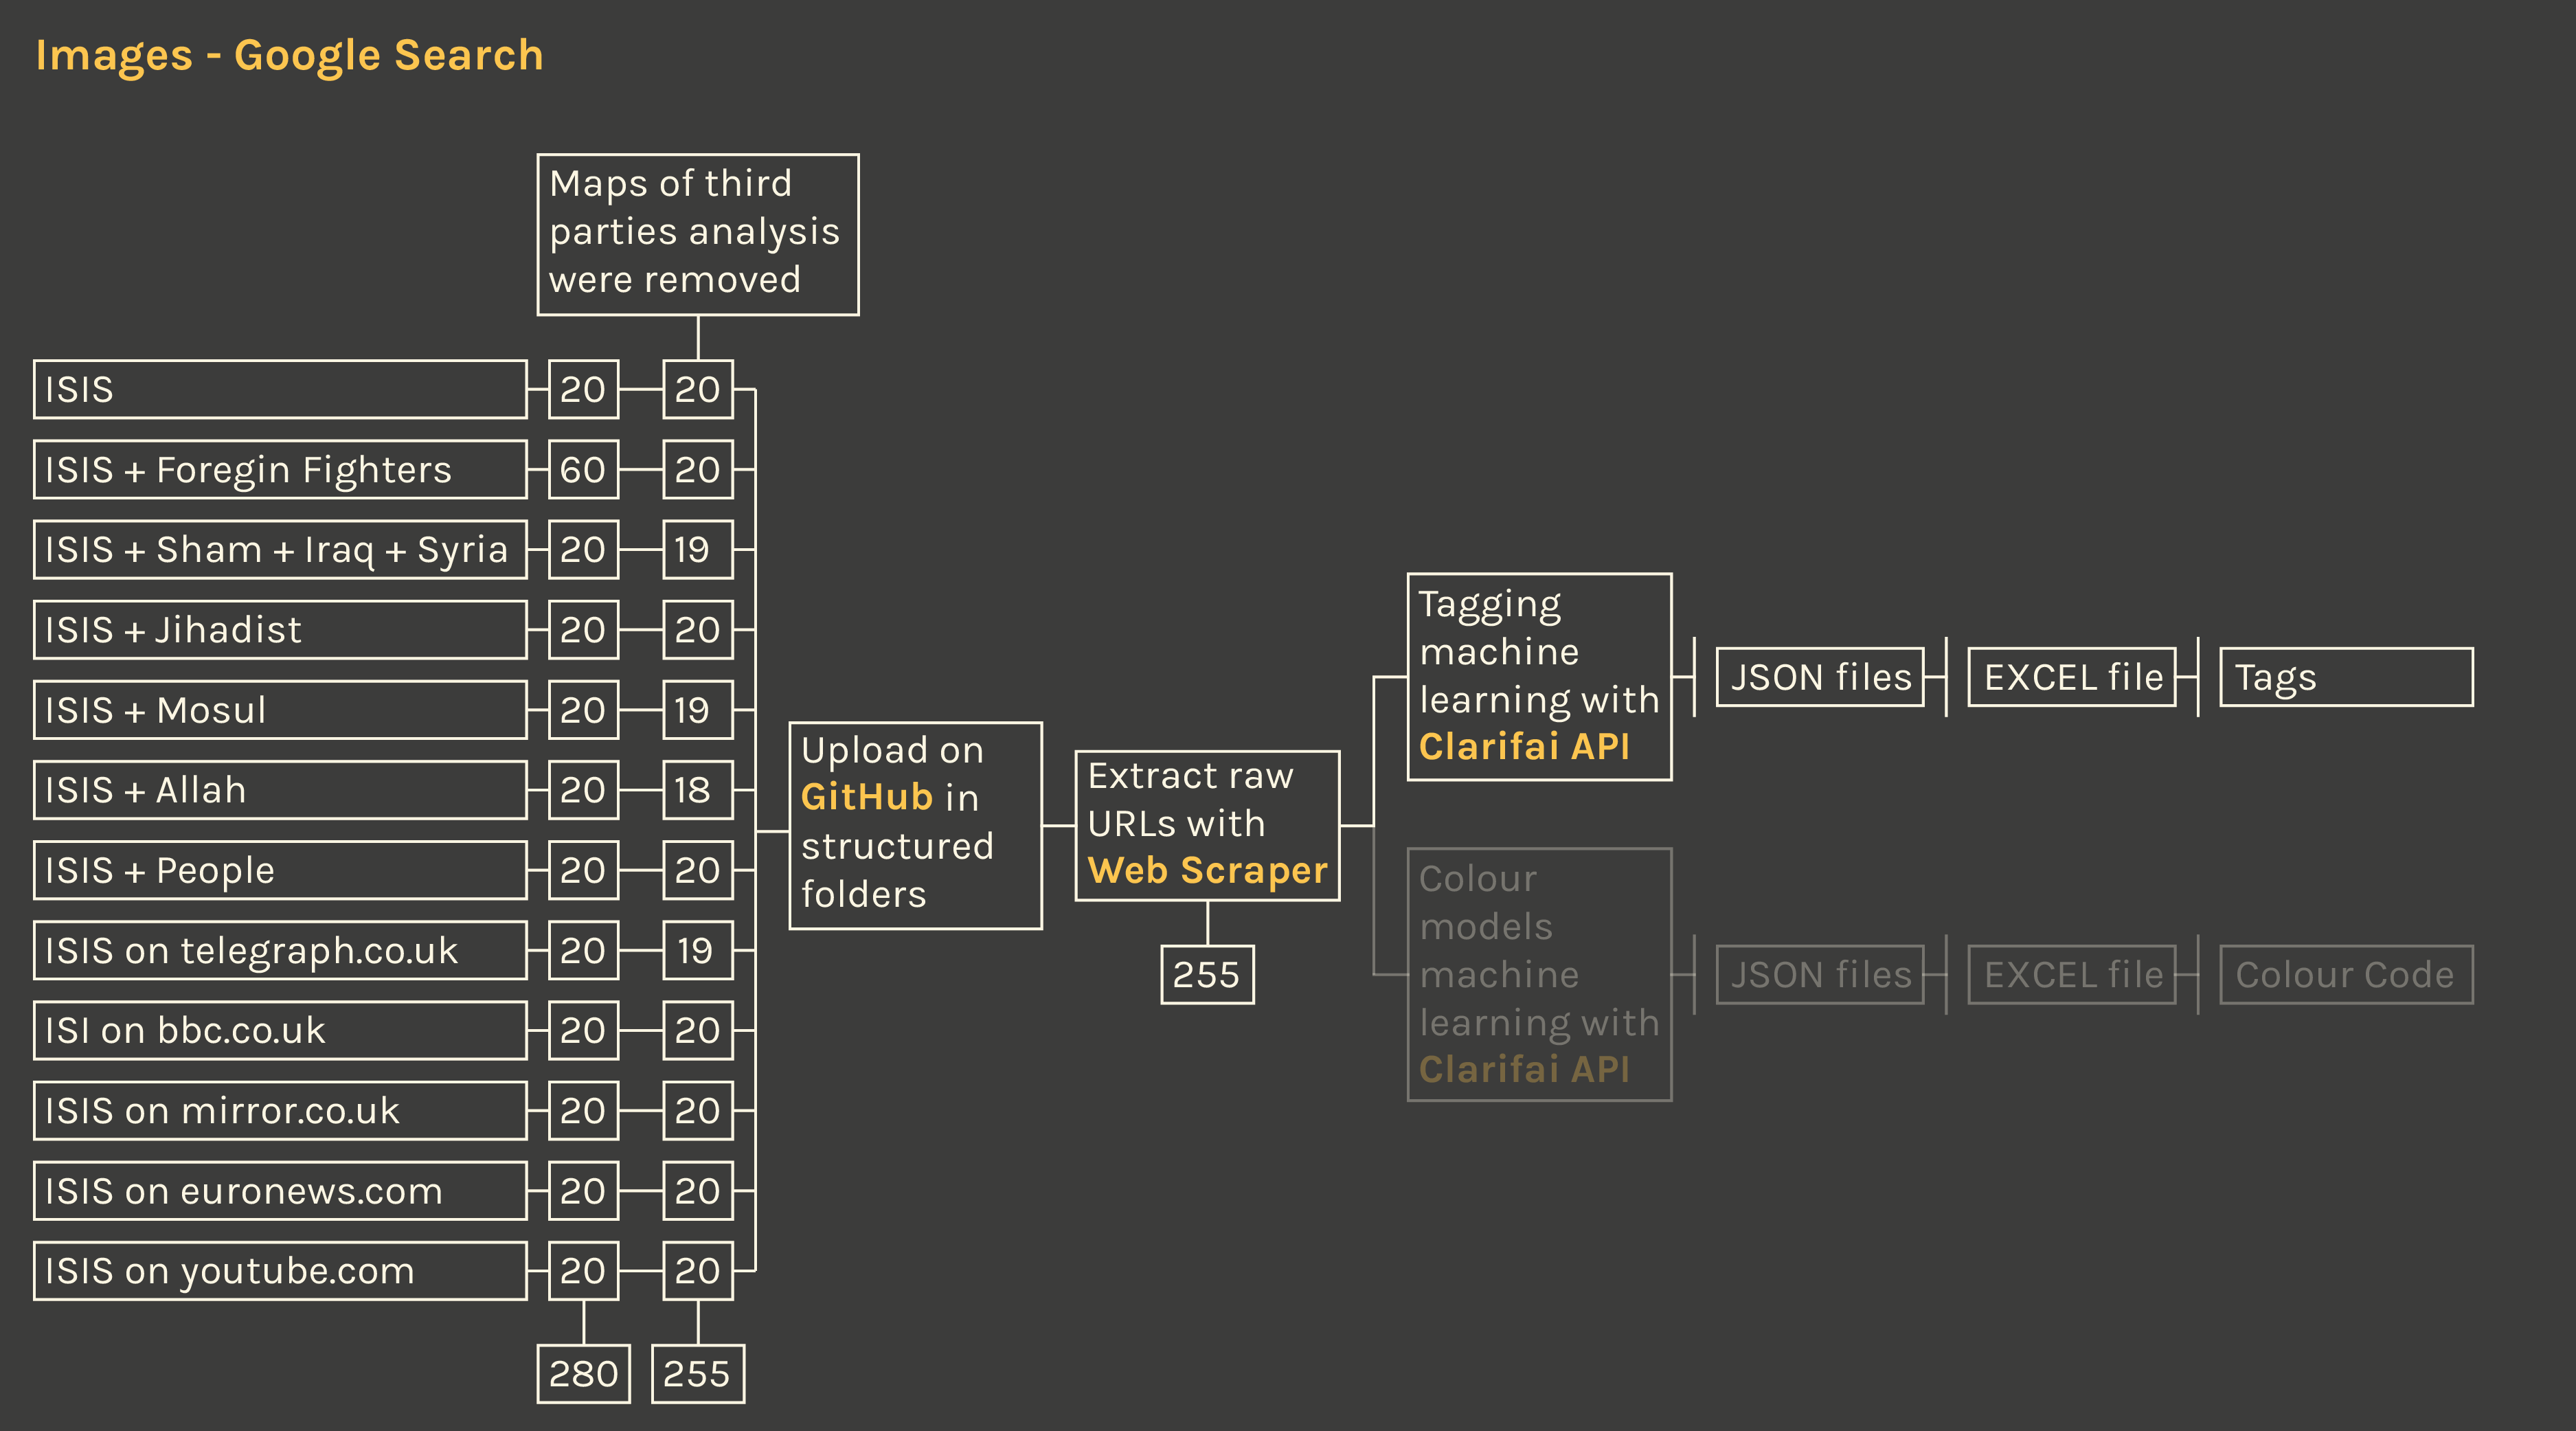
The research of images on Google was done to verify how different media represent the IS in terms of visual content. The research queries were selected in order to compare different sources: (i) “ISIS” on Google images in general; (ii) “ISIS + foreign fighters” from the previous research phase; (iii) “ISIS + Allah”, “ISIS + people”, “ISIS + Sham + Iraq” are the most recurrent words in the official magazines Dabiq and Rumiyah; (iv) “ISIS + Sham + Iraq”, “ISIS + jihadist”, “ISIS + Mosul” are the words where the controversy is focused on Wikipedia based on how many times those words were changed; (v) “ISIS on telegraph.co.uk”, “ISIS on euronews.com”, “ISIS on mirror.co.uk”, “ISIS on bbc.co.uk” to filter results by european media as analyzed for news articles; (vi) “ISIS on youtube.com” to include the image given by a media largerly used for the communication of the IS on the web.

The analysis of the images with the Clarifai APIs allowed tagging through the means of machine learning. The visualization compares the distribution of tags per every query, allowing to locate the similarities and the differences between the images resulting from all the queries. For every tag, the average percentage is highlighted with a yellow line. The bars indicate the query-specific percentage and are yellow when close to the average line and grey when apart. The threshold that determines the color change is 2.5 percentage points, so when the percentage value differs from the average by less than ± 2.5%, the bar is yellow; if the percentage value differs from the average by a greater value than ± 2.5%, then the bar is grey. What stands out is that the predominance of yellow bars signals a strong similarity between all the queries. Hence the visual communication of the media included in the queries is very consistent and gives back a particularly stereotyped image across-the-board despite the different nature of the queries.

Protocol

For every query, a research on images.google.com was done. With the Google Chrome extension “Faktun Batch”, the first 20 image results for every query were downloaded. For the query “ISIS + foreign fighters”, 60 images were initially collected because for a big part they were maps of analysis carried out by third parties. Of the initial corpus of 280 images, 255 were selected by deleting those not pertinent to the research; for the query “ISIS + foreign fighters”, only the first 20 images were kept of the resulting 40 after cleansing. In order to access the Clarifai API, the URLs for every image were needed. All the images were uploaded in query-structured folders on GitHub and with the Google Chrome extension Web Scraper all the raw URLs were collected into an excel file. The URLs were then used in batches of 20 on Clarifai to extract AI tags. The resulting JSON files were mounted into one excel file using OpenRefine. The visualization was done in NodeBox and finished in Illustrator.

Data

Timestamp: 07/12/2016 - 11/12/2016

Data source: Clarifai

The first dataset has one column that identifies the query, one column contains the URLs of the images, hence the images file names for identification, one column that contains the tag name, and finally the probability value of the confidence of Clarifai API’s assignment. The dataset has a single page dedicated per each query and one page with all the data listed together.

The second dataset is a synthesis of the first dataset to calculate and extract the values used in the visualization. The final percentage value is used to determine the position of the bars in the visualization and was calculated using the frequency of appearance of each tag for every query multiplied by the total probability of the tag name in the query. The table titled “distance from average” was compiled by subtracting the percentage value from the average value per each query, in order to calculate the value needed for the comparison with the threshold of ±2.5% to assign color to the bars in the visualization.