Description

Object of the visualization are the images that come from one of the official media used in the communication campaign carried out by the IS. Dabiq and Rumiyah are two magazines published by ISIS in order to recount statements and articles about news, reasons, opinions and propaganda of the Islamic state. The visualization puts in relation the edition of the magazines, on the x-axis, and the number of recurrence of tags for every image included in the edition, on the y-axis, organized by category. The size of the rhombus describes how many times an image of an edition is tagged for each category. Parallel to the x-axis, a timeline displays the major events involving the Islamic state. Interesting insights and information come out from a crossed reading of the data. The graph allows different readings: the evolution in time of the magazines, and in detail the evolution of single tags. Through the reading of the graph, the reader is provided with a tool aimed to the understanding of the communication strategies of one of the media used by the IS.
Protocol

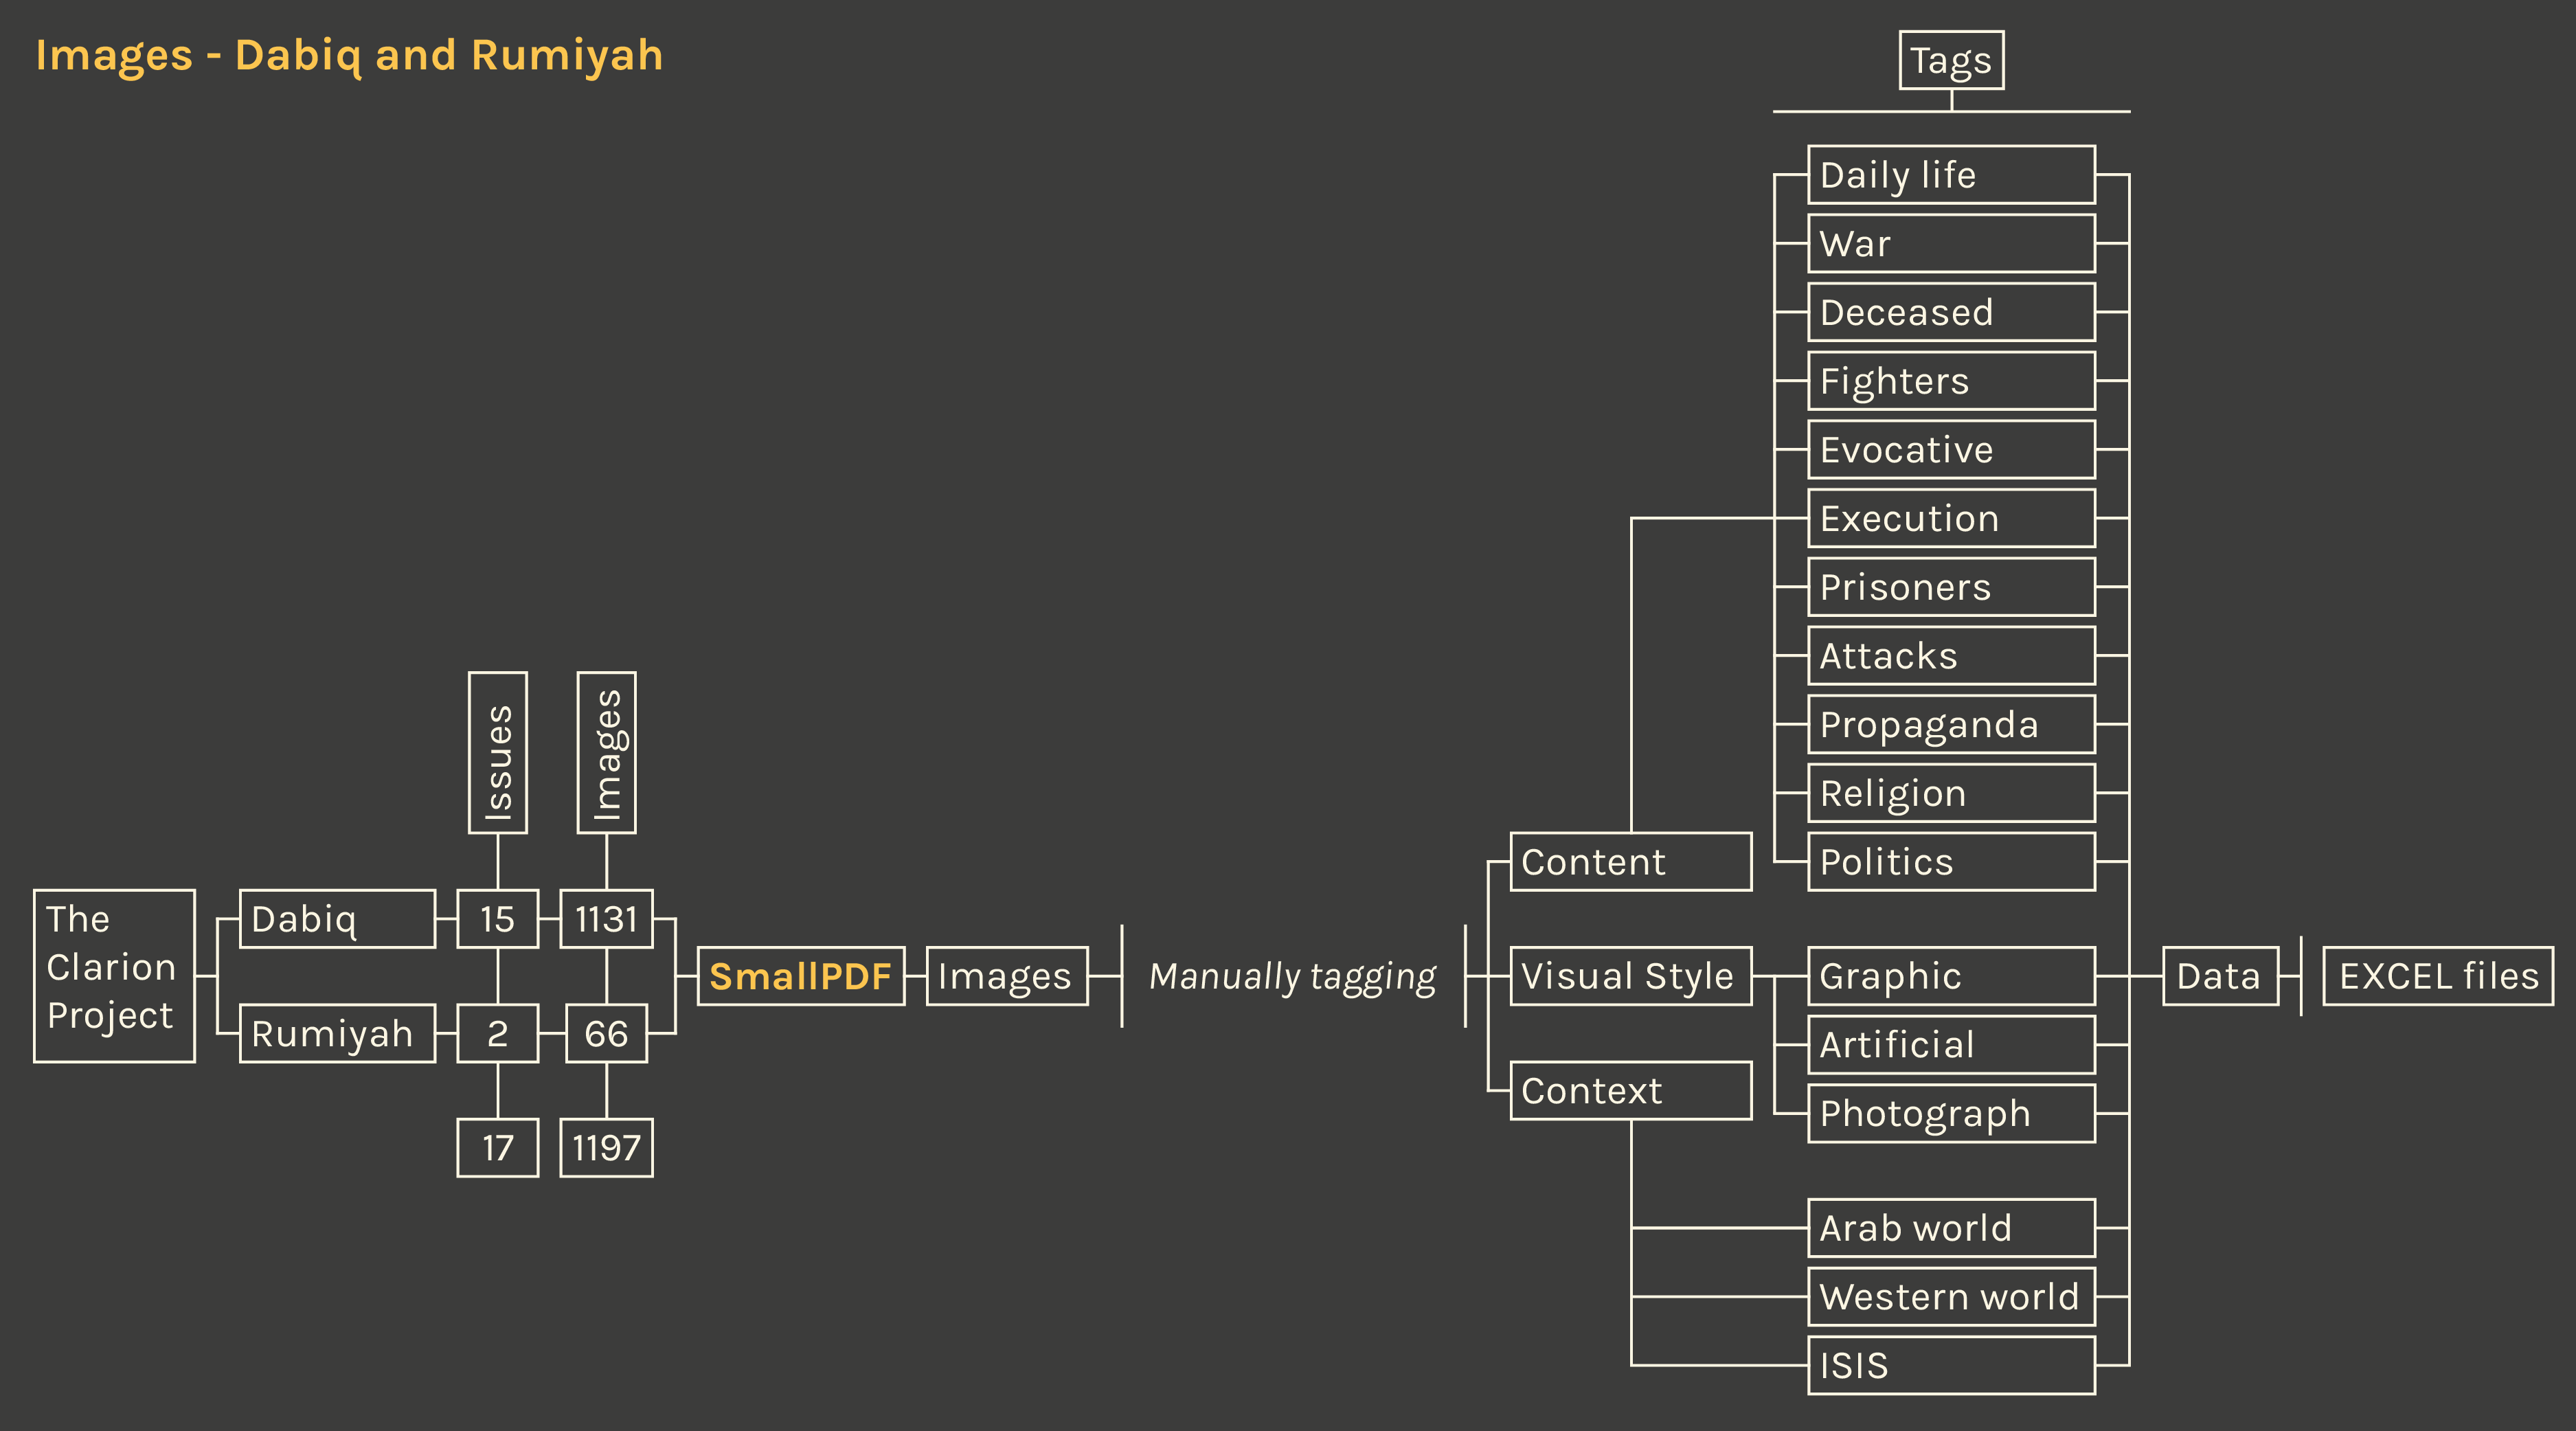
The images from the official magazines by ISIS were analyzed. The available issues of Dabiq and Rumiyah were obtained from the association The Clarion Project which gathers and collects different Islamic material. Dabiq is composed of 15 issues, Rumiyah of 2 issues. The images were extracted from the PDFs using SmallPDF, an online tool, resulting in 1131 images for Dabiq and 66 for Rumiyah, in total 1197 images were obtained. The images were manually sorted in three main thematic areas: context, visual style and type of content. Additionally, for every image, content-specific tags were assigned by hand. These are for content: politics, religion, propaganda, attacks, prisoner, execution, evocative, fighters, deceased, war, daily life; for visual style: photograph, artificial image, graphic; for context: ISIS, Arab world, Western world.

Each image can have multiple tags. A total of 2740 tags were assigned. The data was collected in 17 Excel datasets.

Data

Timestamp: 06/12/2016 - 16/12/2016

Data source: Small PDF, The Clarion Project

There are 3 datasets: one Excel file for each magazine for the analysis and a third one to calculate the total values for the visualization. The file containing the data about Dabiq is composed of 15 sheets, each one for each edition of the magazine; using the same scheme, the file containing the data about Rumiyah is composed of 2 sheets. Every sheet has 18 columns, one with the id of the images and 17 that define the tags. Every line corresponds to a specific image of the magazine issue. The numbering of images ids follows the order of appearance on the magazine. The file called “Total image.xlsx” contains the sum of values per magazine edition plus an additional sheet used to generate the bubble chart on RAW.