Description
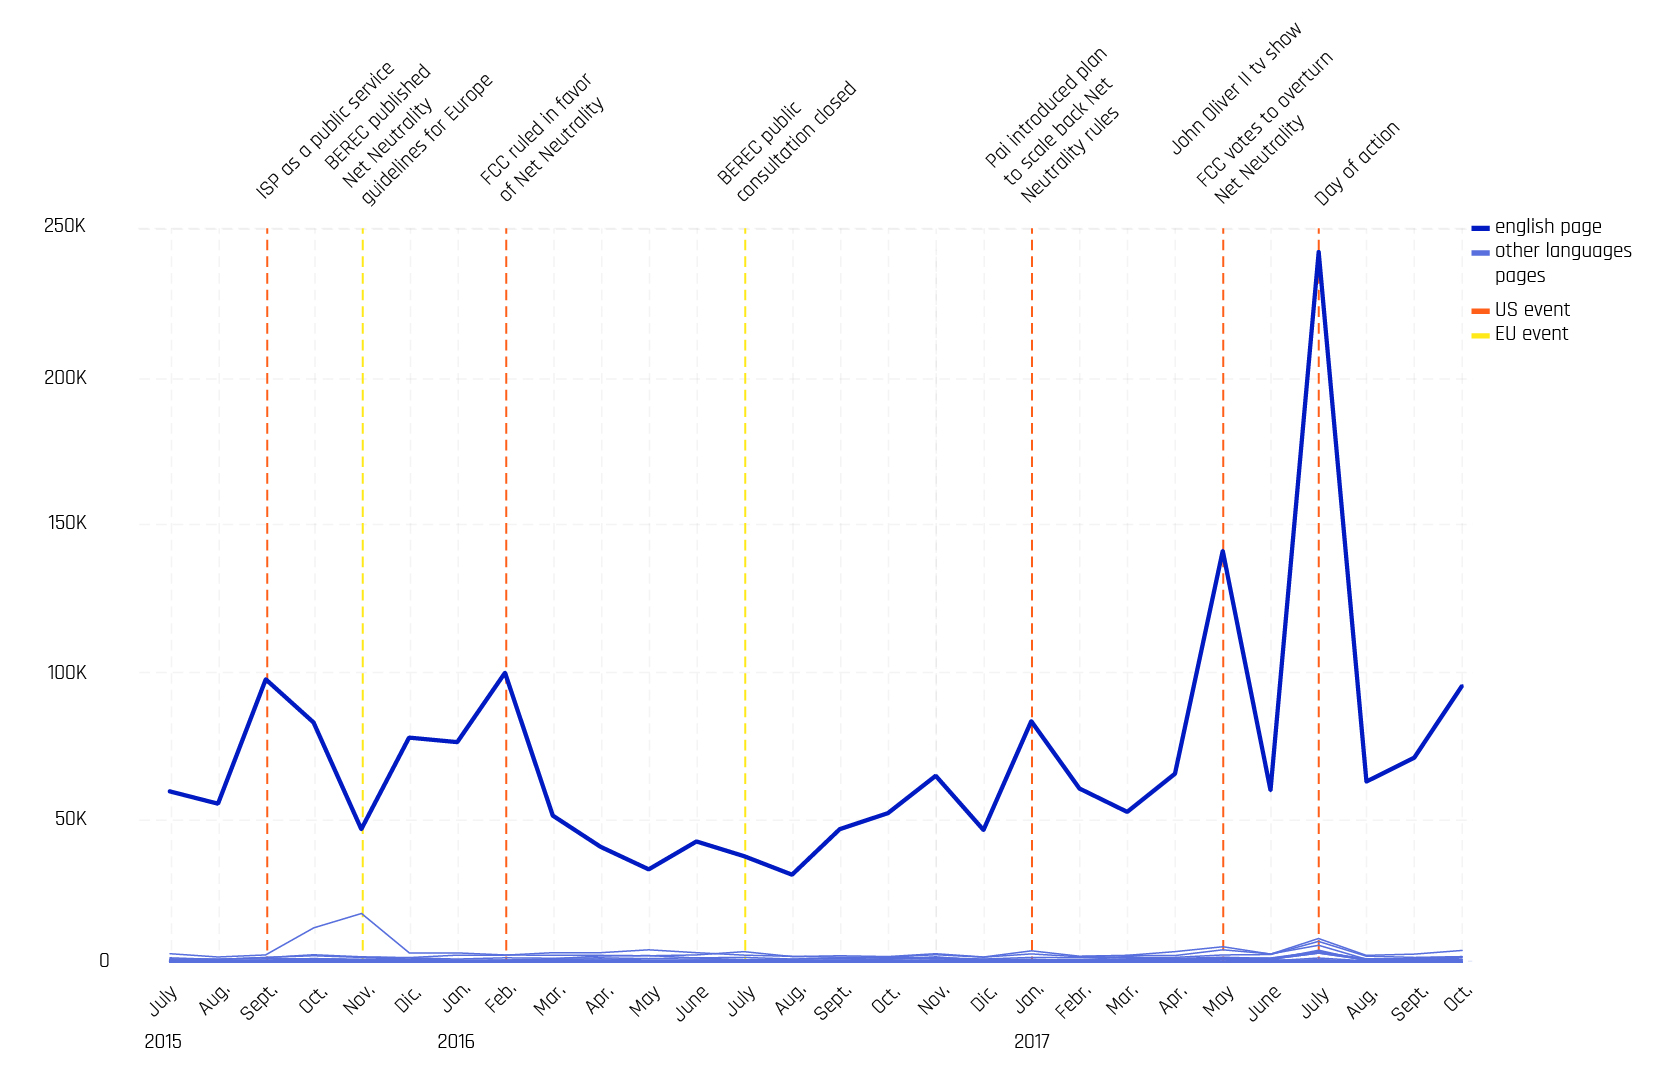
This graph figures out the amount of people demonstrating interest in Net Neutrality on Wikipedia. The number is calculated per million. We put into relation the number of the specific views for the Net Neutrality page with the number of the general views in that language. The proportion between these two categories shows which sphere of languages is more used on Wikipedia, to search information related with our topic. The orange line stands for the English page, we decided to highlight, because it is the oldest, the longest and the most thorough, as shown by the previous protocol. We also underlined the Indian sphere of languages, including more than one language, because the number of people interested in is the highest. The Indian languages are coloured in blue. We coloured in light blue the countries whose lines are less visible as the numbers are similar and lower, because we are not interested in extracting information from them. The yellow squares are put on the view peaks to highlight the correspondence of the peaks for the different languages. We tried to understand the reason why the number of views grow. So, we put on the top the information obtained from the time line of the First Phase and from the news providers of the following protocol.
Protocol
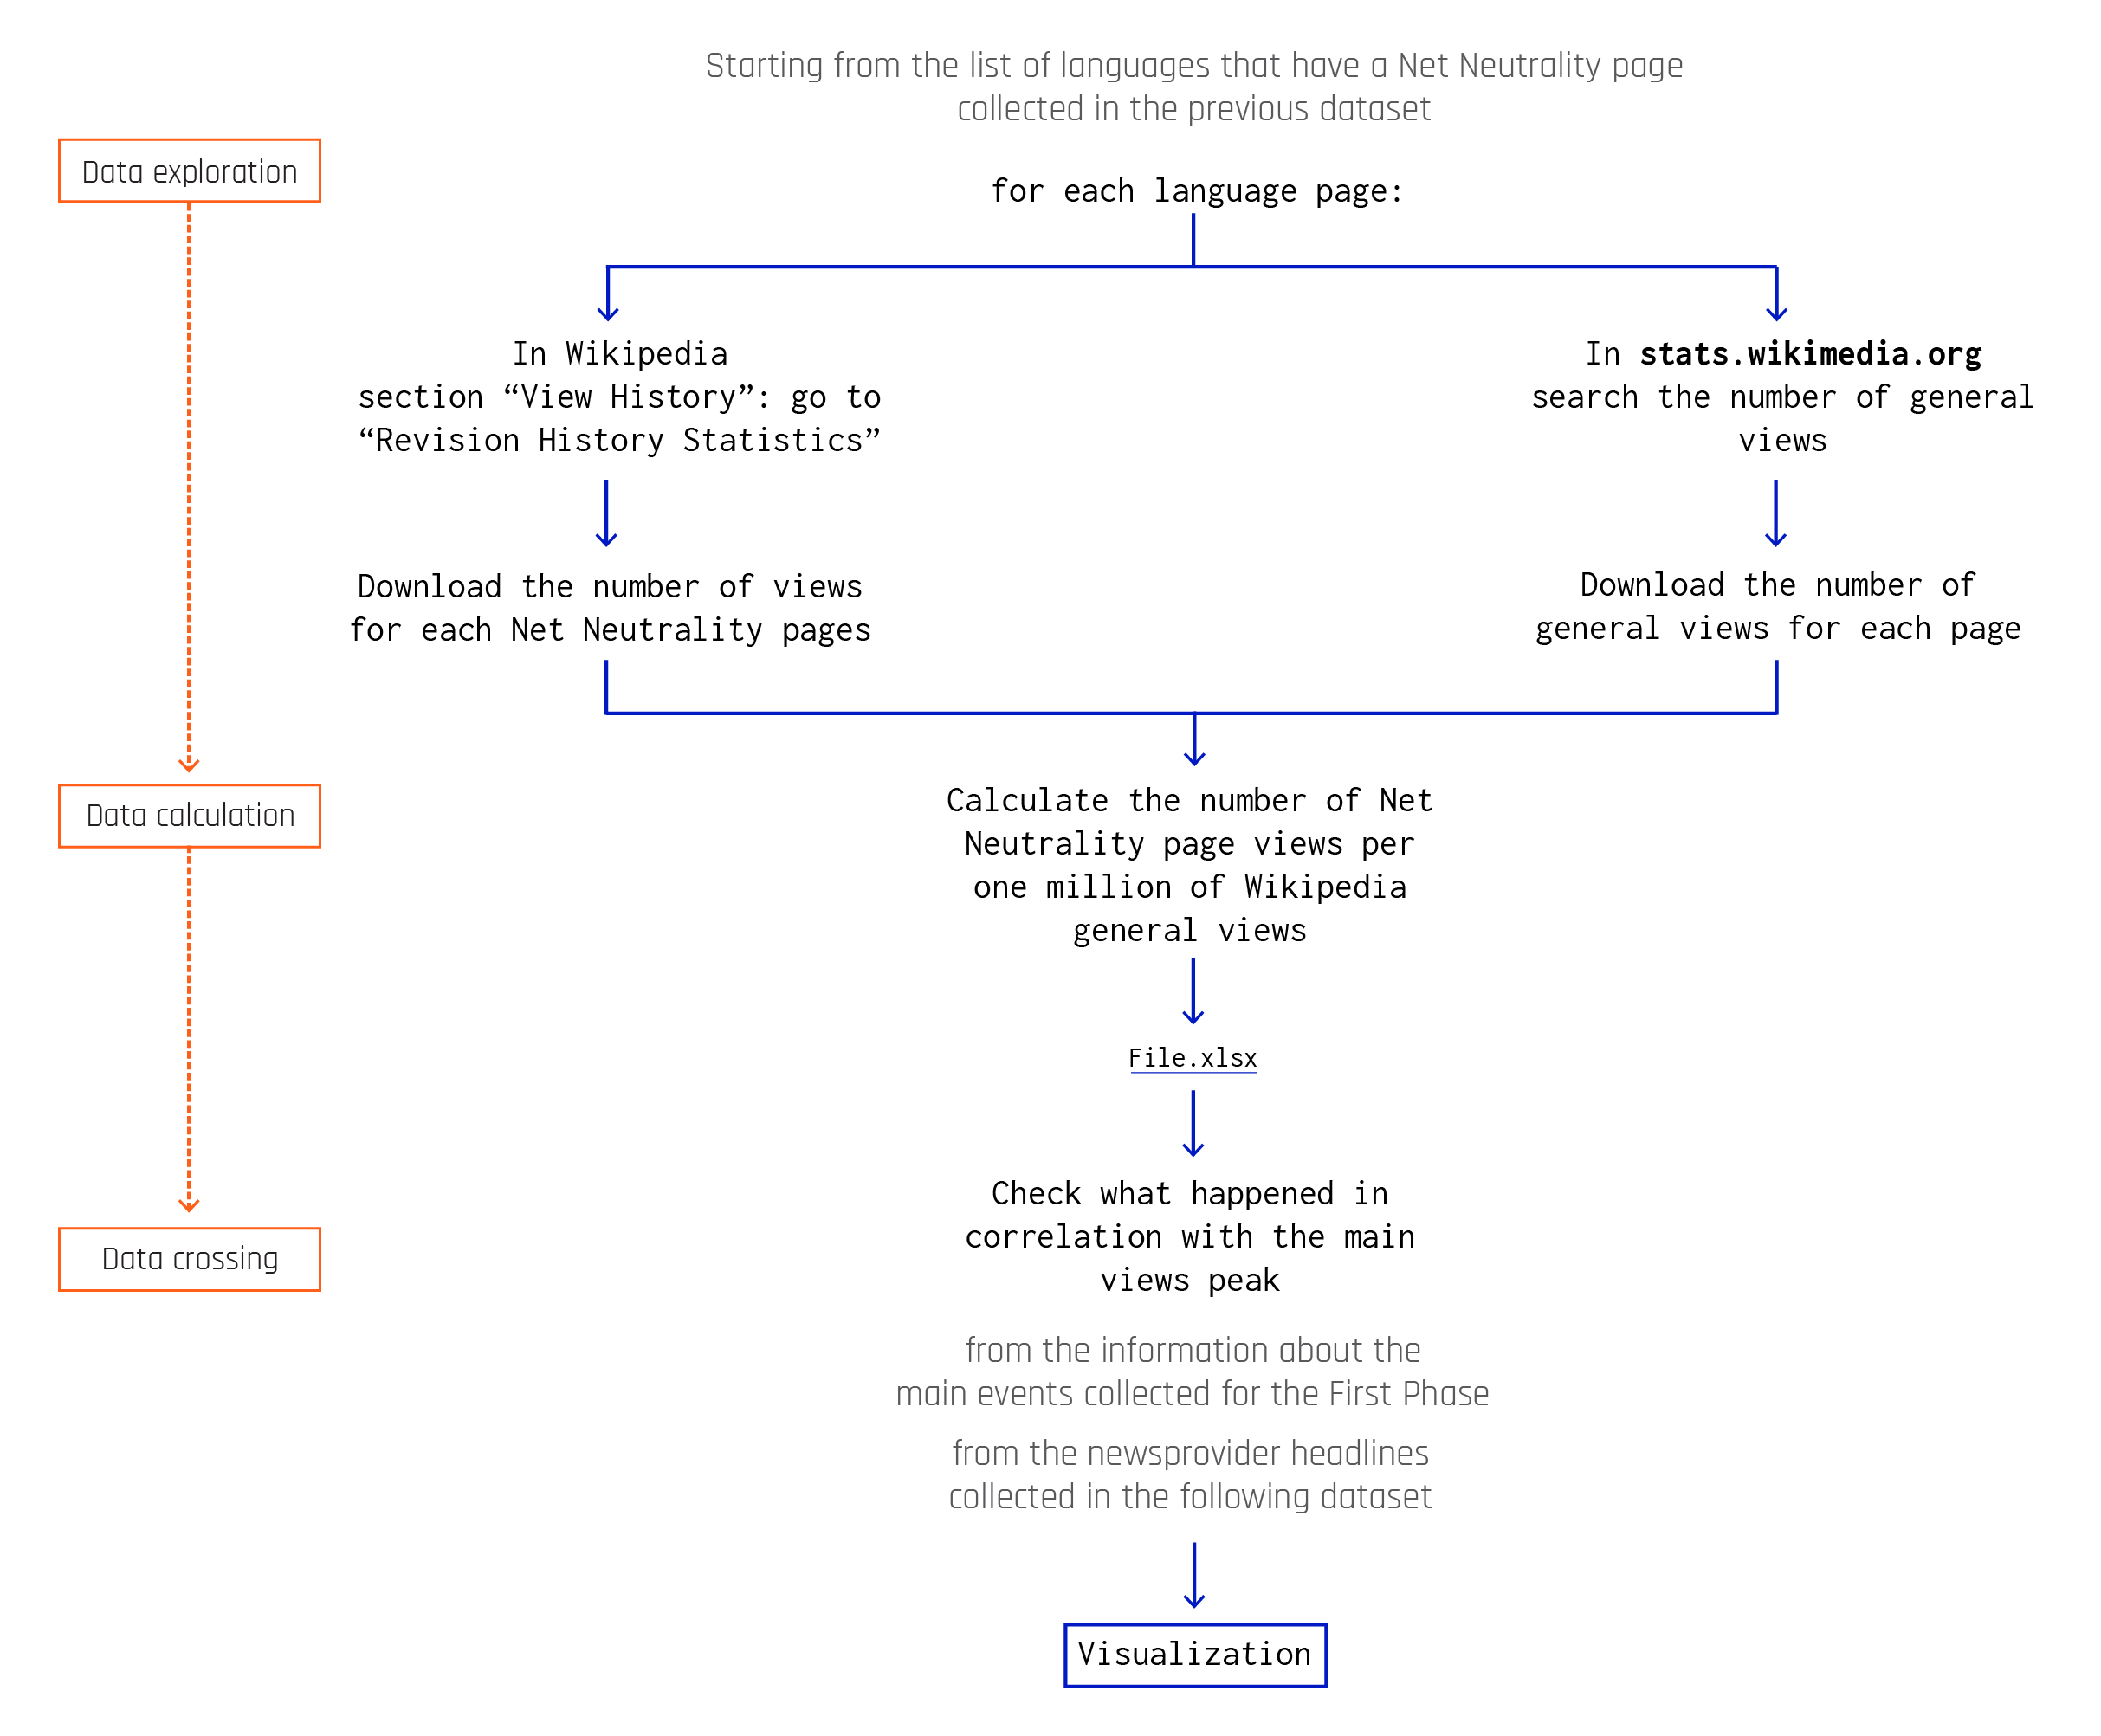
We collected the data of the number of specific views for the Net Neutrality page and the number of general views for each language. For the first information, we used “Revision History Statistic” section, mentioned in the previous protocol. The section is specific for each Wikipedia page, so we collected the data separately and then we assembled them. We got the number of general views for each language from the state.wikimedia.org, that provides for a lot of information, including the number of views by year. We simply based our protocol on the number of views for the Net Neutrality pages, before using this protocol. The result obtained with the previous method highlights the number of views for the English page. The absolute number is still the highest, depending on the amount of the United States citizens and on the quantity of English spoken people. The Indian sphere languages disappears in this first visualization, because the number of English views is higher in a remarkable way. The peaks of the first graph are confirmed in the second one, as well. The months with the highest number of views are the same. It is due to the events producing the increment. So, we focused on the months that generated more views. We looked for the events related to Net Neutrality, to understand what happened during that time.
Data
Timestamp: November 2017
Data source: XTools, StatsWikipedia
Download data (62KB)
The number of general Wikipedia views in each language collected from stats.wikimedia are by million and in some cases, when the number is lower, by thousand. We divided the result of our proportion by million, to make a better visualization. So, we obtained the number of views per one million of views.