Description
The network shows the relationships between people and companies mentioned in the articles used during the last protocol. We used the names appearing at least twice to select the actors taking part in the controversy. Some names are linked because they are mentioned in the same articles. Some names are isolated, because they appear in the headlines without any correlation. The link thickness is calculated counting the number of actors mentioned in the same headline. We also divided the actors in four categories, that are Organization, People and Companies; Companies group is further divided into Telecom and Others. The colour of nodes shows this division. Two main areas are created by these connections. The main one, around F.C.C. (Federal Communications Commission) is an independent agency of the United States government, created by statute to regulate interstate communications. This agency is in the middle of the debate, because it controls the legislation of Net Neutrality. The politicians and some public corporations are positioned close to F.C.C. The other smaller group is drowned on the opposite side and includes the category called Other companies. These are the companies mentioned in the articles, because they take part in the debate or in some other cases because they violate the neutrality. These two groups are linked by means of Telecom companies. If Other companies are mentioned in the headlines in relation to someone else, it is because they appear related to Telecom companies. Telecom companies operated like a bridge between the political and the economic spheres.
This second graph is meant to show first the name of the newspapers we used to extract the actor names and second to make visible the number of articles written by each newspaper. So, the bars represent the number, while the colours represent the time range when the newspapers covered the news. The bars are blue if the newspapers have written articles recently. We used the gradient: 2017 is the most recent. The bars become lightly if the date of articles goes back into the past. In the opposite way, the bars are orange if the articles were written in 2006 and they get lightly moving to nowadays. All the newspapers analysed covered the news at least once: some of them starting from a lot of years ago, some others only during the last years, when the debate became noted. The gradient wants to highlight this different time of interest.
Protocol

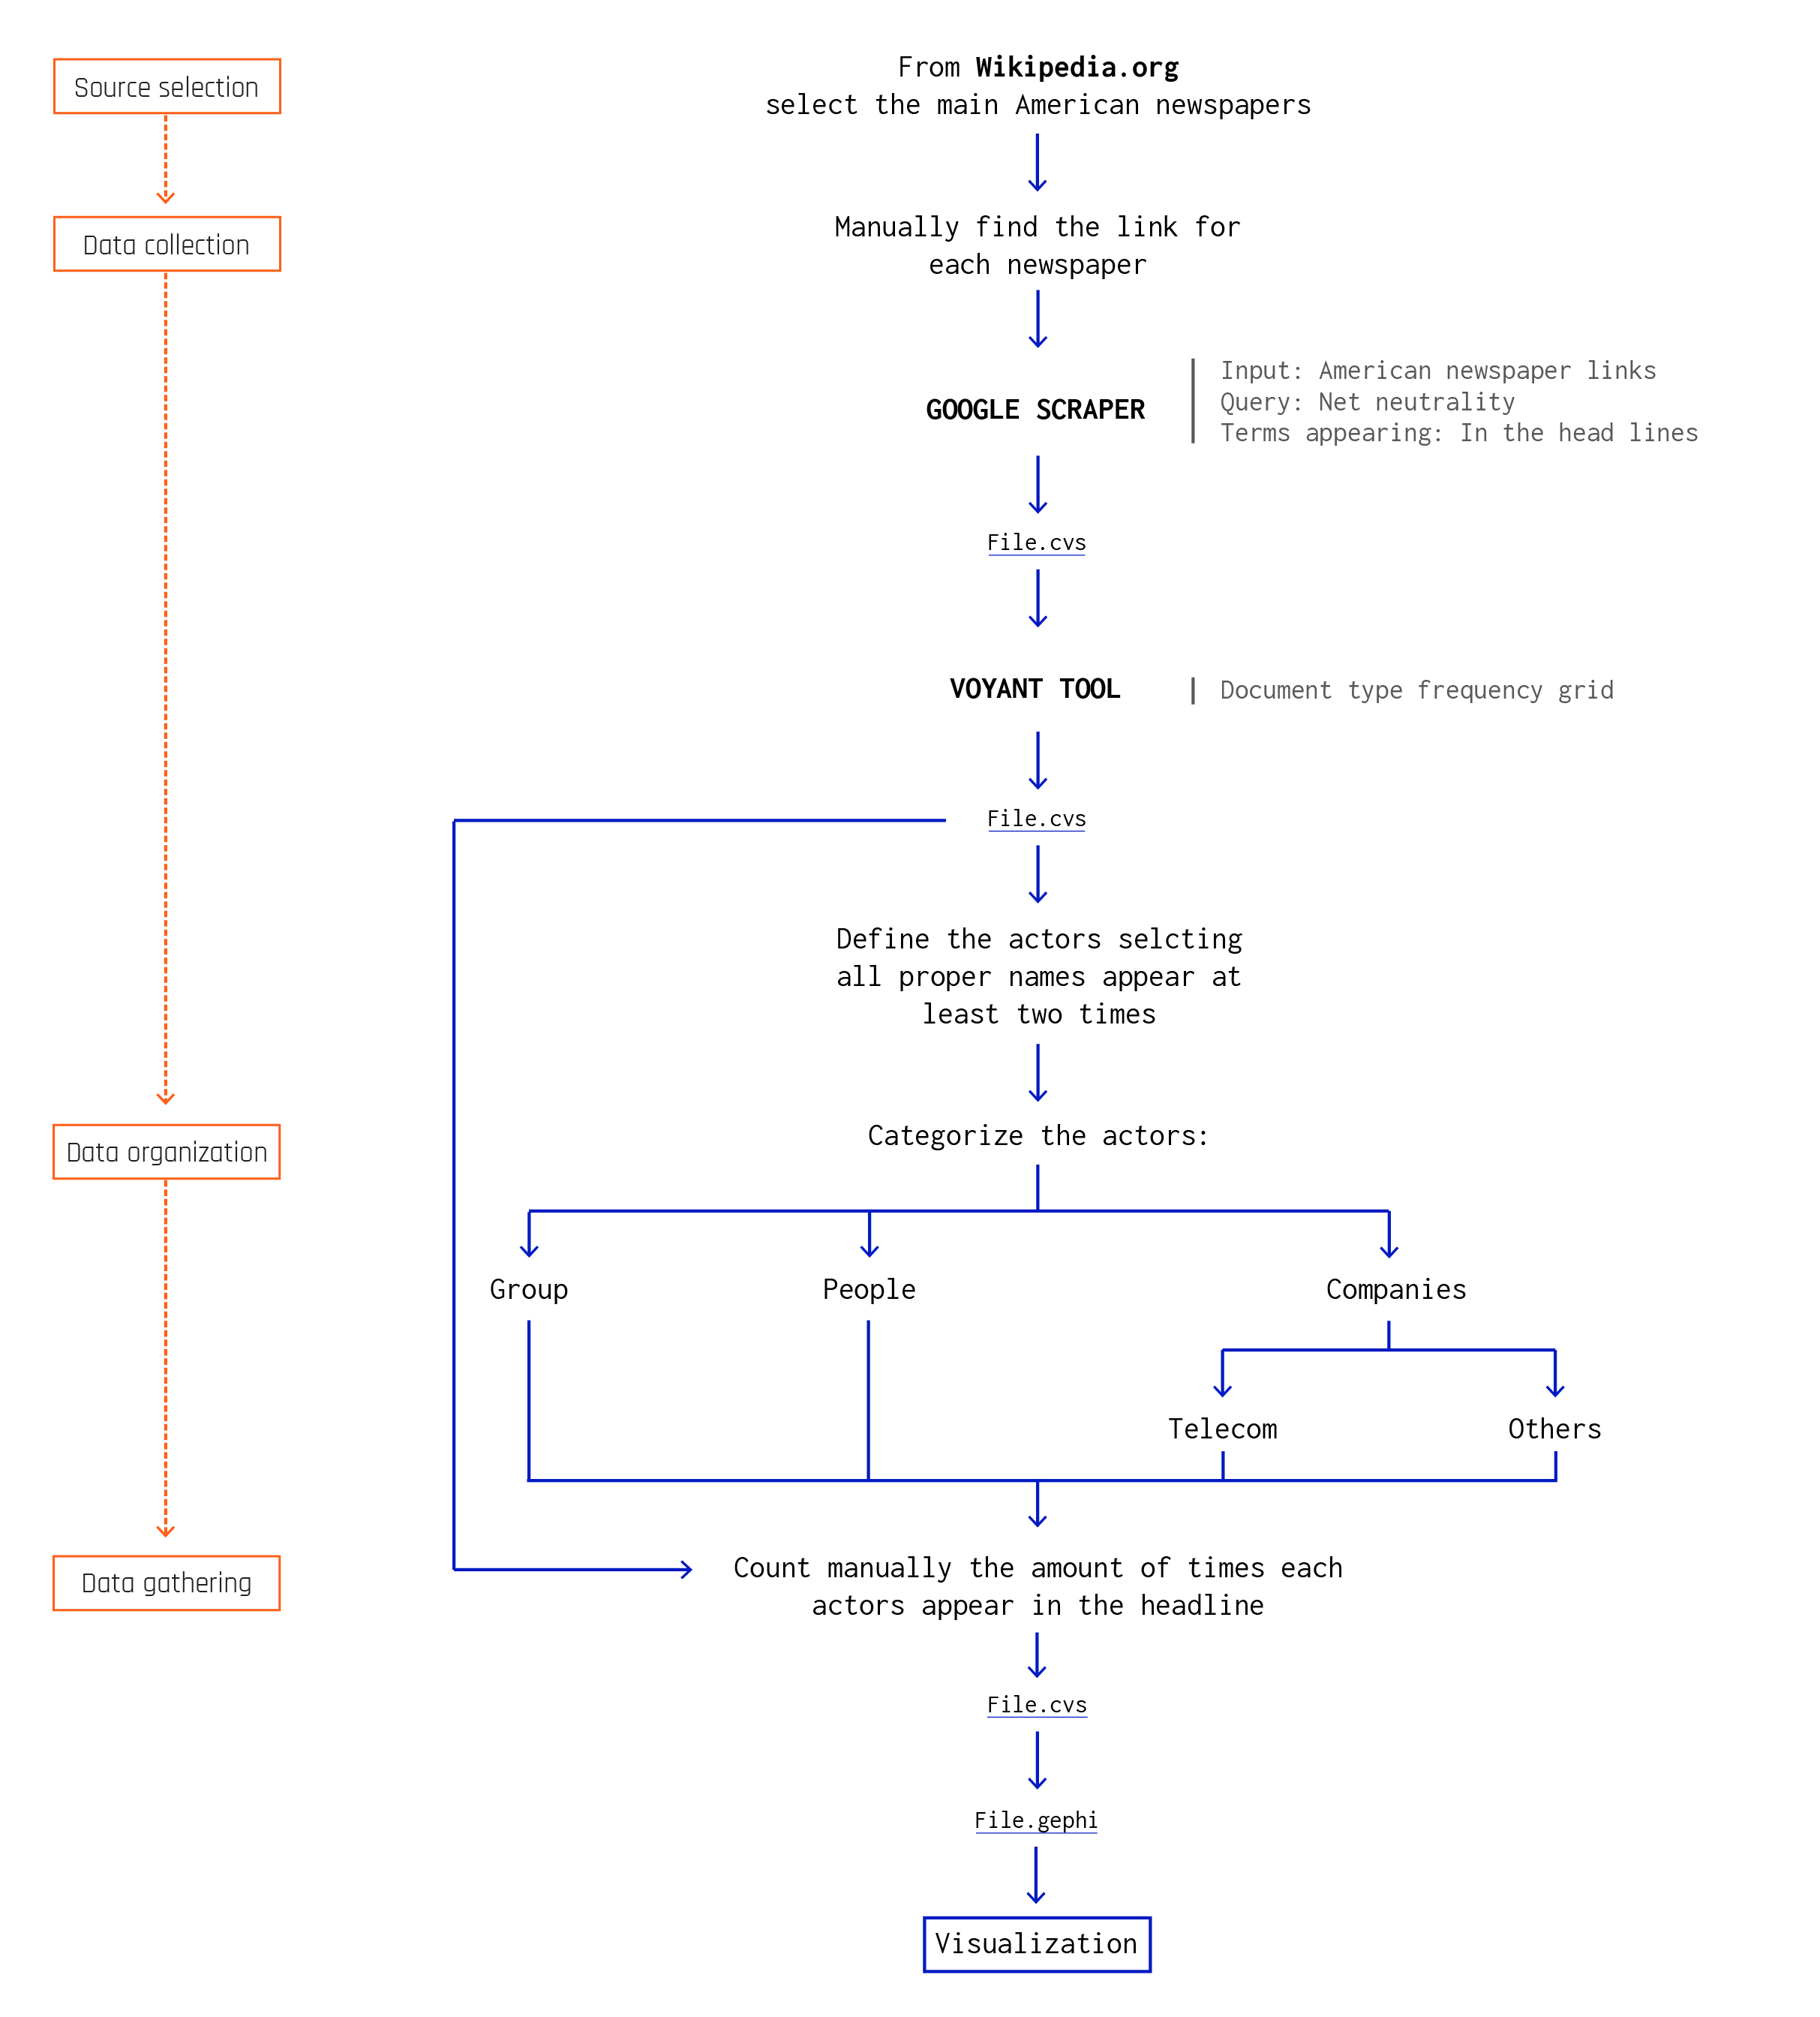
First of all, we decided which American newspaper consider. There are a lot of newspapers in the United States, so, we took from Wikipedia a list that mentions the main. Then, for each of them, we search manually for the link and we made a list to use in Google Scraper. We set the Term “Net Neutrality” and we set the research “In the headlines”. We cleaned the file we obtained, then we put the file in the Voyant Tool to extract the name from the headlines and then we selected the proper names that appear two or more than twice and we categorized the names: People, when they are proper single names; Organization, when they refer to entity or agency; Companies for the business groups. We also distinguished Telecom Companies from Other Companies to highlight the relationships. We counted the number of articles obtained from Google Scraper. We divided them by year to show the number of the articles written and the level of involvement of each newspaper.
Data
Timestamp: November 2017
Data source: Google Scraper, Voyant Tools - Word Counter
Download data (79KB)
From Google Scraper we obtained a list of articles that mentions Net Neutrality in the headlines. From this output file, we also considered the date of the article publication for the second visualization. We used Voyant Tool to extract the proper names. An output file gave us a list of name appearing at least twice and then we categorized them.