Description
The visualization shows the level of online involvement of the Other companies category mentioned in the previous protocol. The company names are ordered by the number of mentions in the headlines. Starting from Netflix, that is the one that appears more than others, to Mozilla. The headlines quoted on the left show the number of the frequency they are mentioned. On the right side, a time line displays the online activity related to the Net Neutrality, done by each company. We analysed the company’s blog and their Twitter account to understand if they spread information and contents related to our topic. Each row stands for a company. The colour of the bars is done by the number of posts they wrote. The darker the bar is, the higher the number of posts is. The orange line is for posts on Twitter, while the blue one is for posts on their own blog. We ordered the actors in this way to make an interesting information visible. The level of their interaction is inversely proportionated to the times they are mentioned in the articles. So, the more they are mentioned, the less they post. Indeed, Mozilla, that is mentioned the minimum, is the one that spreads more contents about Net Neutrality.
The company names are here the same as in the top graph; but here we tried to understand the way they are mentioned. Starting from the articles, we realize that newspapers mentioned the companies for two opposite reasons. When the companies were active to defend Net Neutrality or when they were accused of violating it. So, we tried to understand in which context, positive or negative, they were cited. The blue square up on the company names stands for a positive context; on the opposite way, the orange square in the down direction means a negative context. From this visualization, we found out something curious: a lot of companies are mentioned in both contexts, because they apparently fight for the neutrality, violating the rules at the same time. The flow chart is a precondition to understand the bar chart. It represents the words appearing most frequently related to the term “Net Neutrality”. The name order and also the flows thickness show the time they appear in the headlines. The words are grouped according to the meaning they take on in the context: positive or negative.
Protocol
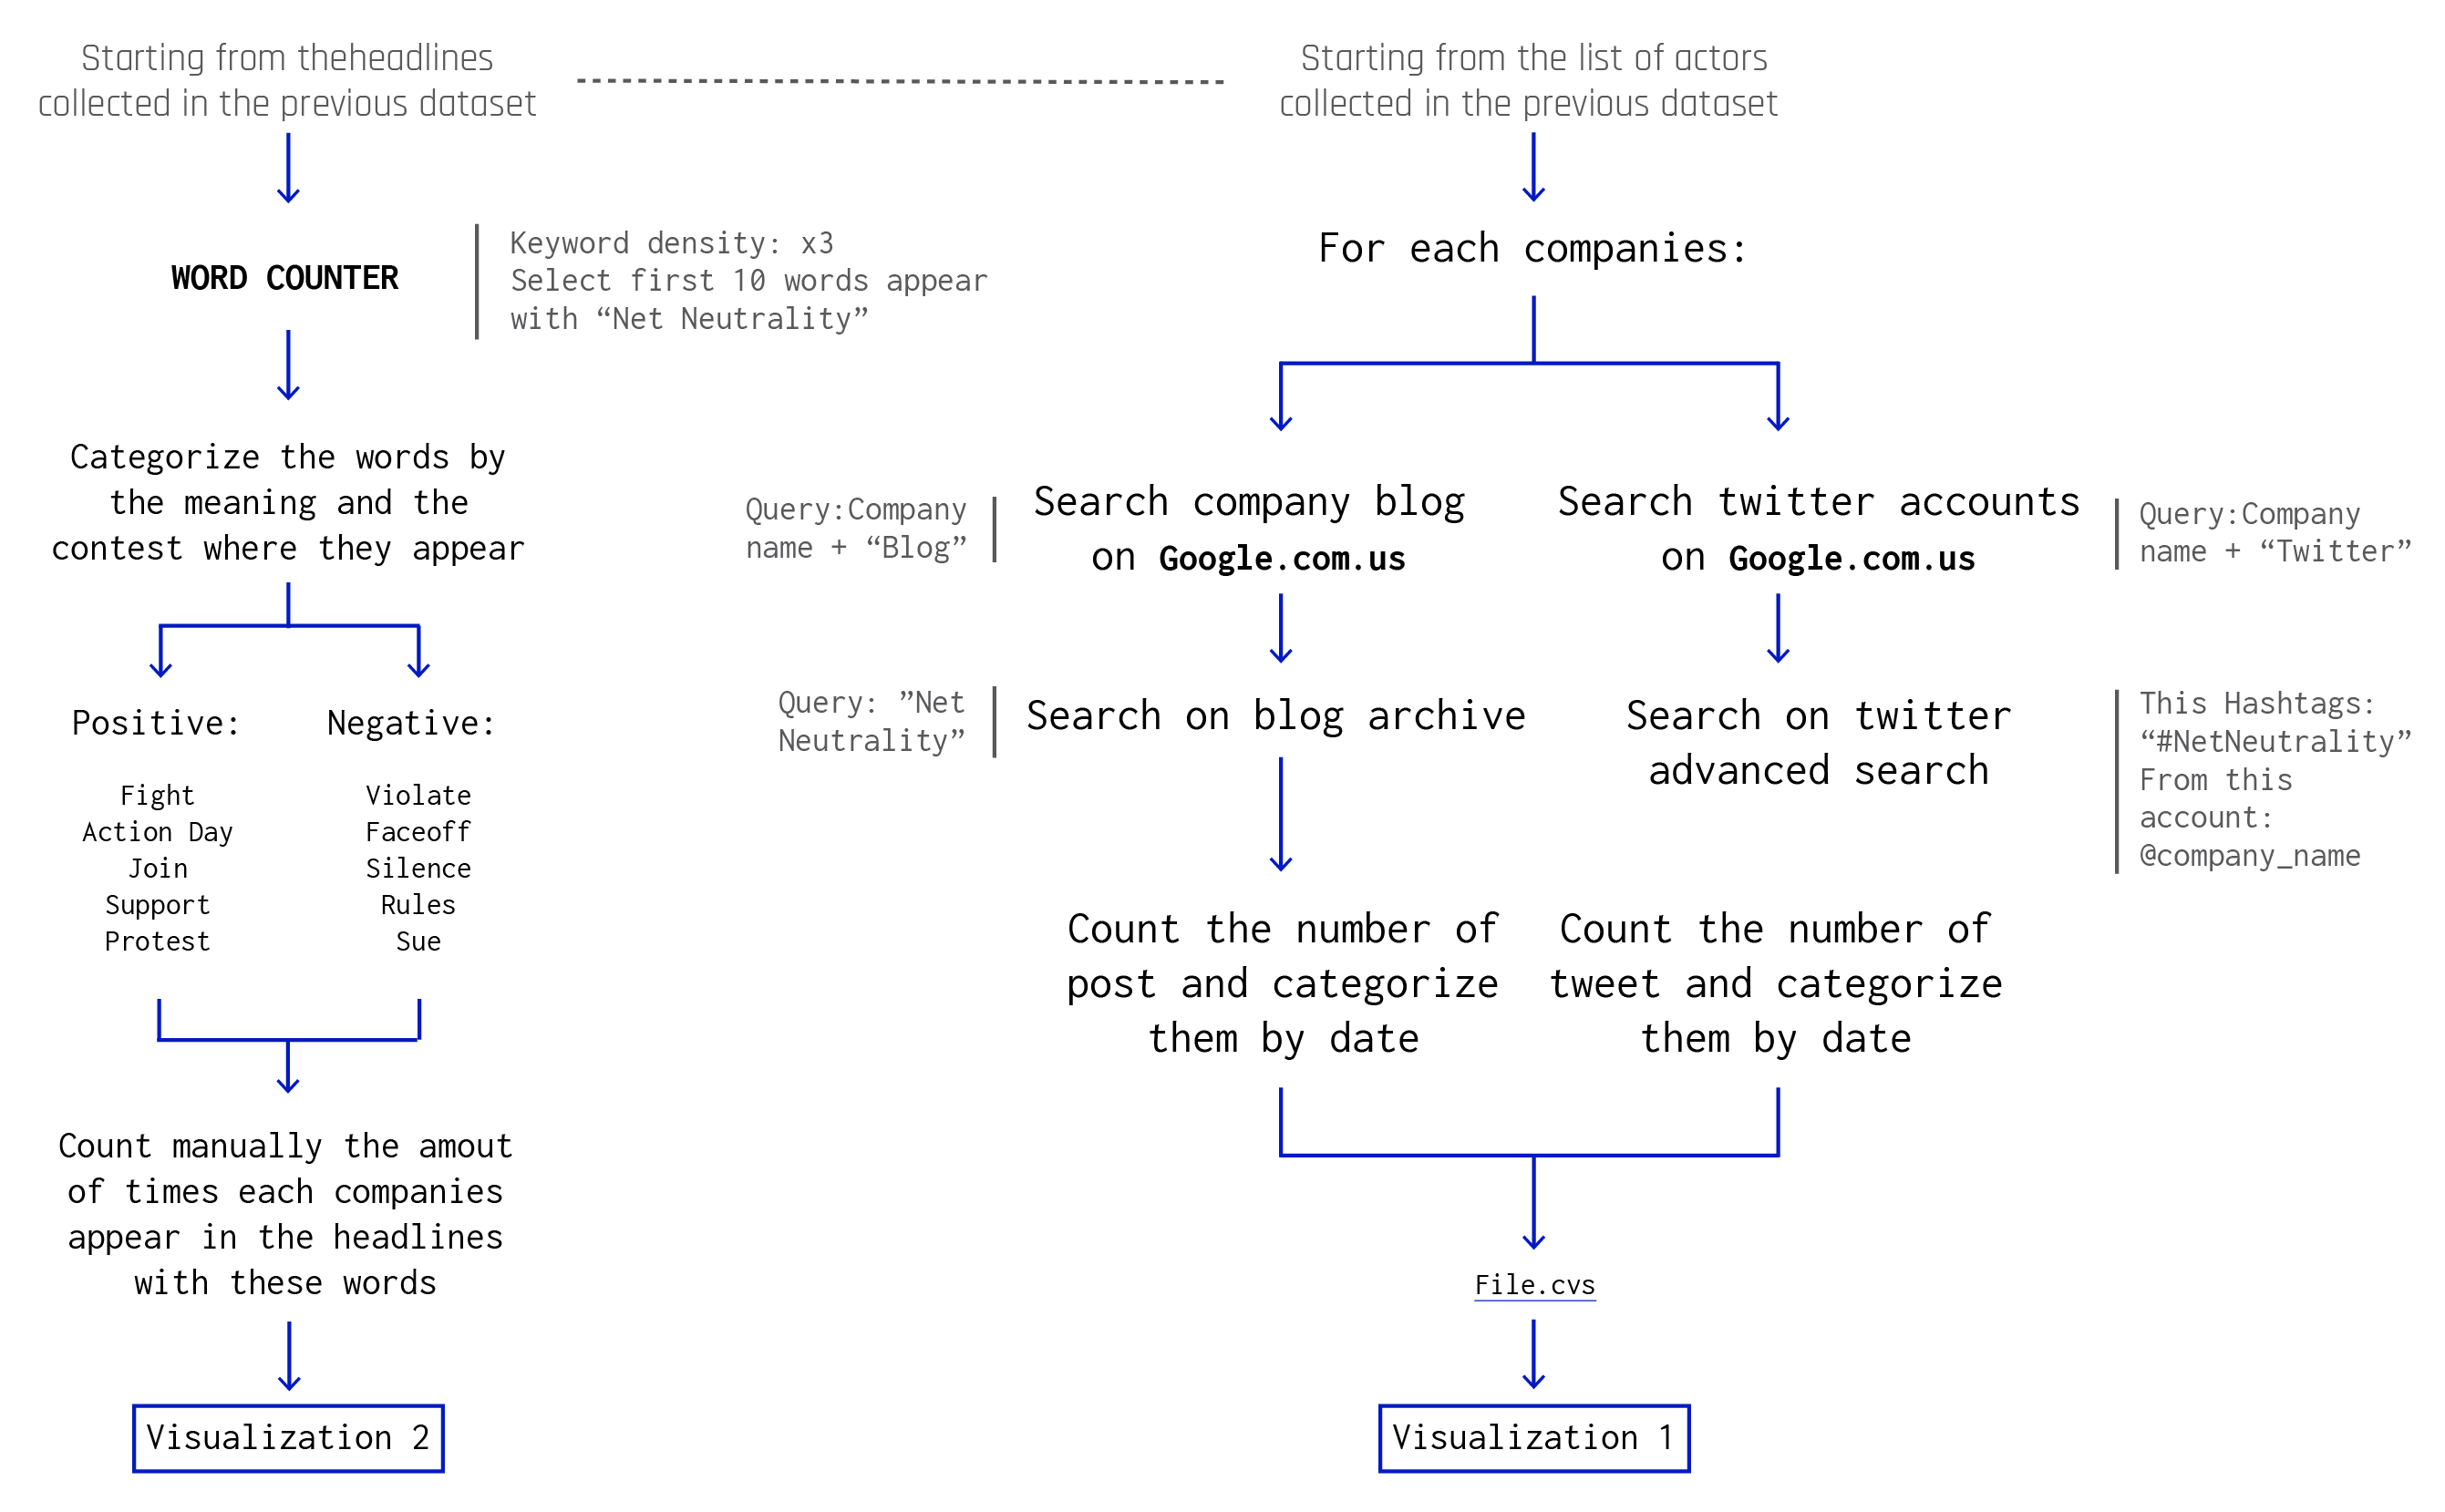
We searched the companies’ blogs and their Twitter account to collect the data for this protocol. For the blog, we looked on Google, putting the company name and the word “Blog”. Then, we searched in each blog archive if there were some posts or articles about the topic. For Twitter information, we made first a list of the companies’ accounts, searching on Google; then, we used Twitter Advanced Search to pick up the post written by their accounts. We considered the number of both kind of posts by year. We made something experimental for the second step: we put the headlines in Word Counter and we considered the frequency of the words appearing with the term “Net Neutrality”. We divided the words obtained by the context where they appeared. We did not consider the absolute meaning of the words, but the meaning of the words related to this specific context.
Data
Timestamp: November 2017
Data source: Voyant Tools - Word Counter, Twitter Advanced Search
Download data (42KB)
We collected first the blog and Twitter pages where we could look for the posts; then we selected the relevant posts and we gathered them. These data are focused on the amount of the interaction generated by the companies.