Description
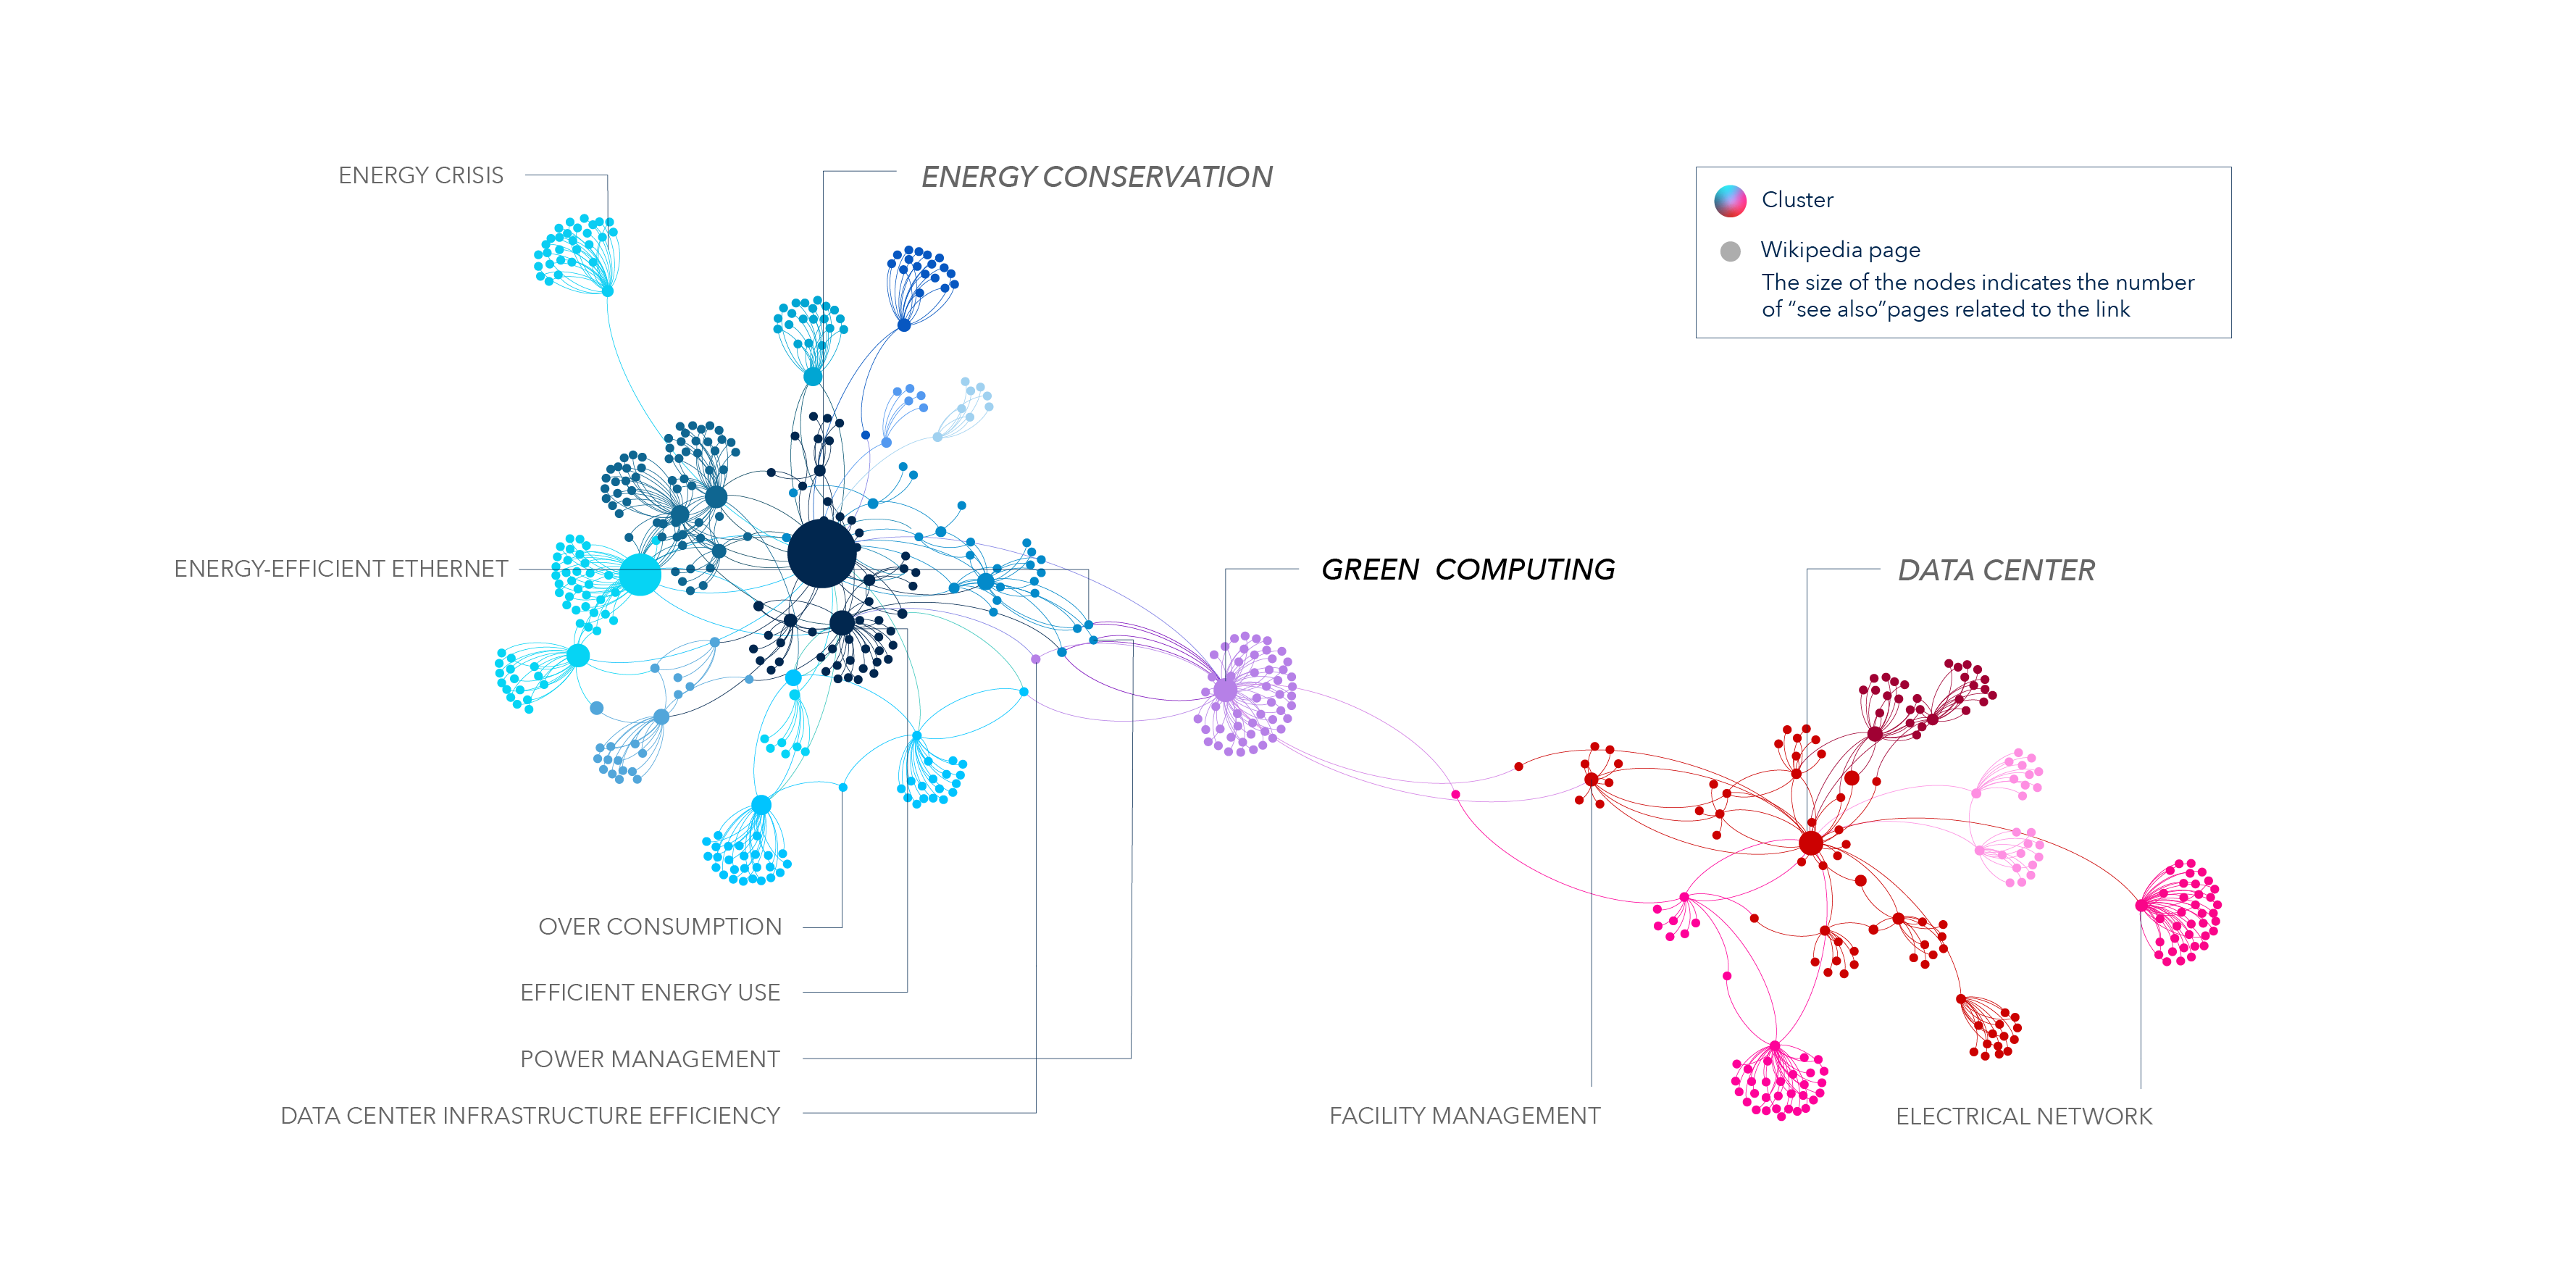
When discussing the relationship between data center and energy (we choose energy conservation as our main topic), we want to continue the further research in order to find out which topics are related to them. In this visualization, you can see the connection of ‘data center’ and ‘energy conservation’. The other clusters and dots represent pages related to the main seeds at two levels of depth. These points are respectively derived from ‘data center’ and ‘energy conservation’ and present a hierarchical relationship, different colors represent a cluster, and The final intersection of these two themes is ‘green computing’ , you can see other related topics connect to it such as ‘power management’, ‘facility management’, ‘data center infrastructure efficiency’, ‘efficient energy use’ and so on. Through this picture we have found the key node ‘green computing’ in many related topics and will carry out the next research on it.
Protocol

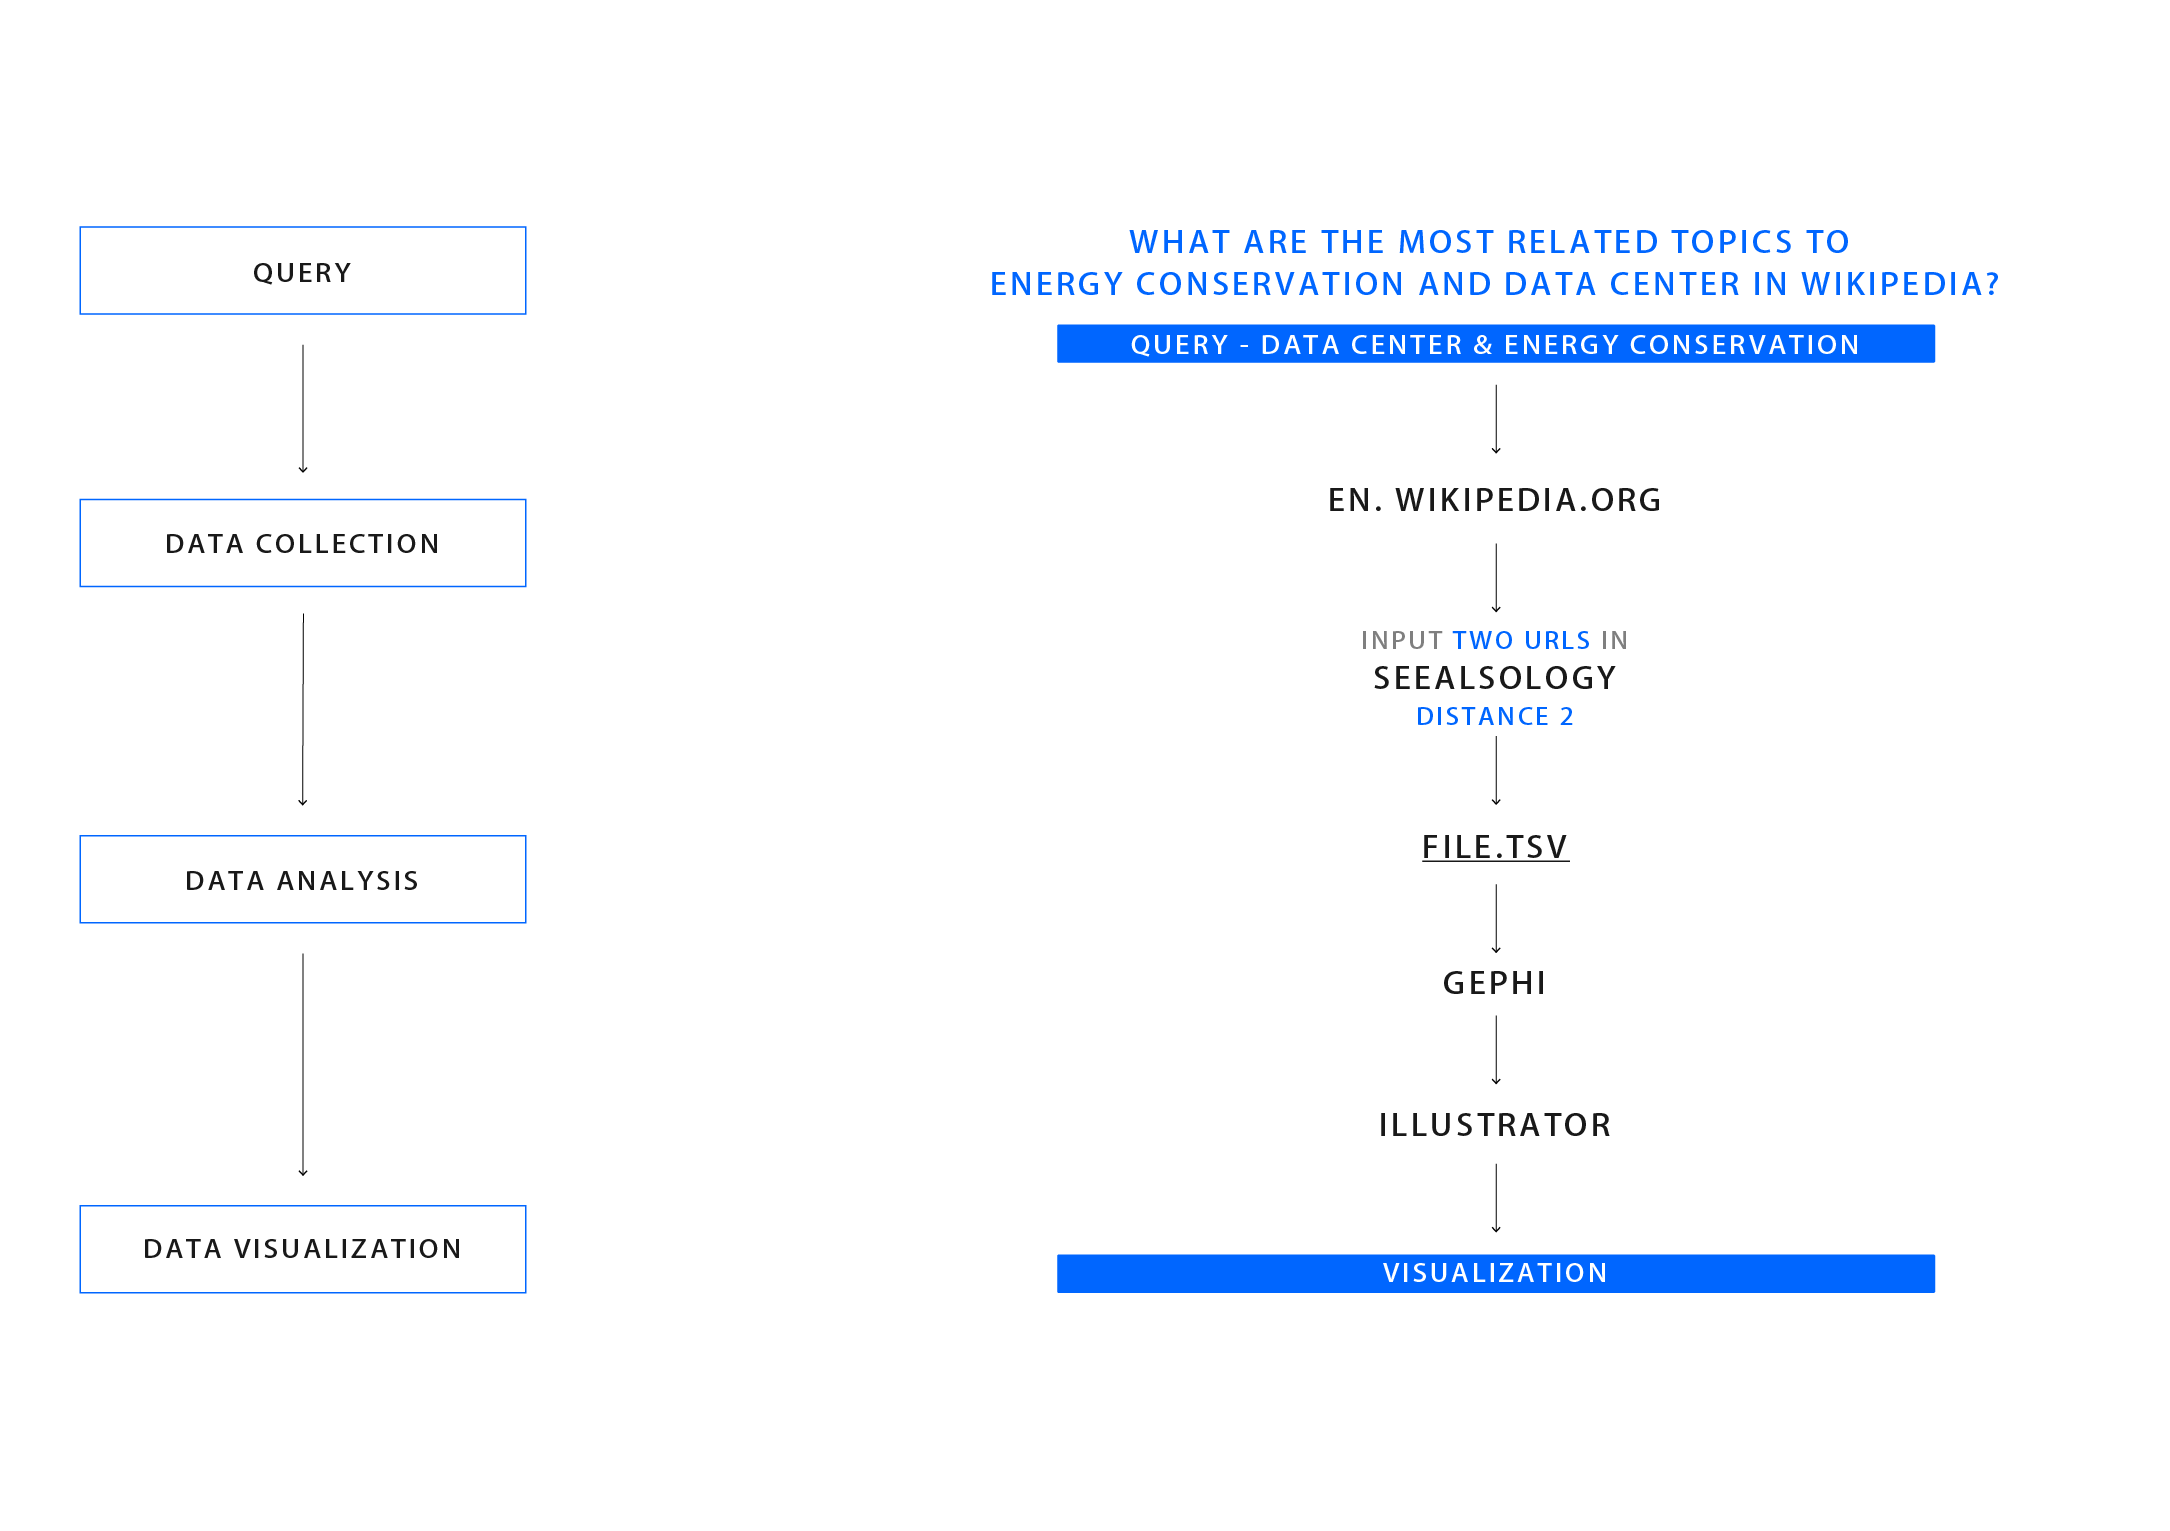
When discussing energy issues in data centers, we are curious about when and what causes people to start paying attention to energy issues in data centers. So we searched ‘data center’ and ‘energy conservation’ in Wikipedia, then input two URLS in SEEALSOLOGY, and by extracting the graph we defined the network of the topics in relation with both queries. In the network, we set The distance to 2, because we want to find more connection between two queries.
Data
Data Source: Wikipedia(https://en.wikipedia.org/wiki/Data_center)
Timestamp: 01/11/2018
View Data (32Kb)
We have found the URLS of Wikipedia “Data center” and “Energy conservation” pages and use Seeslsogy to output a new TSV.file.
