Description
The last protocol, we focu on social media, which rarely talk about data centers. Compared to the social medias like Twitter or facebook, YouTube makes it easier to observe the public’s comments on an event through dynamic videos with a variety of detailed comments. So we selected 12 videos about the data center with relatively high playback volume of more than 50,000 times.
With IBM TONE ANALYZER, we can divide those comments into seven dimensions: JOY, ANALYTIC, TENTATIVE, CONFIDENT, SADNESS, FEAR and ANGER. The emotions of the seven dimensions are expressed through the radar chart, which clearly shows that the discussion of the video is more focused on which emotion.
The TreeMap sorts according to number of thumbs-up in comments, and classifies them based on emotions. Therefore, the logical relationship between the levels is expressed as: the first level is 7 different emotions. The second level is which relevant videos comprise comments that belong to certain specific mood. The third level is the specific comment related to this emotion under the video, and the size of each rectangle express the like count of the comment, so the larger the area of the rectangle, the more people agree with the opinion and emotion.
By analyzing the emotions implied by the comments in these videos, we found that the emotions analyzed by comments are positive in general (JOY/COMFIDENT). And video commentary on issue of data center energy consumption is also more biased towards neutral temptations(TENTATIVE,ANALYTIC). It shows that for youtube, people in social media have a certain understanding of this topic, but they don’t have a deep understanding of it.
Protocol
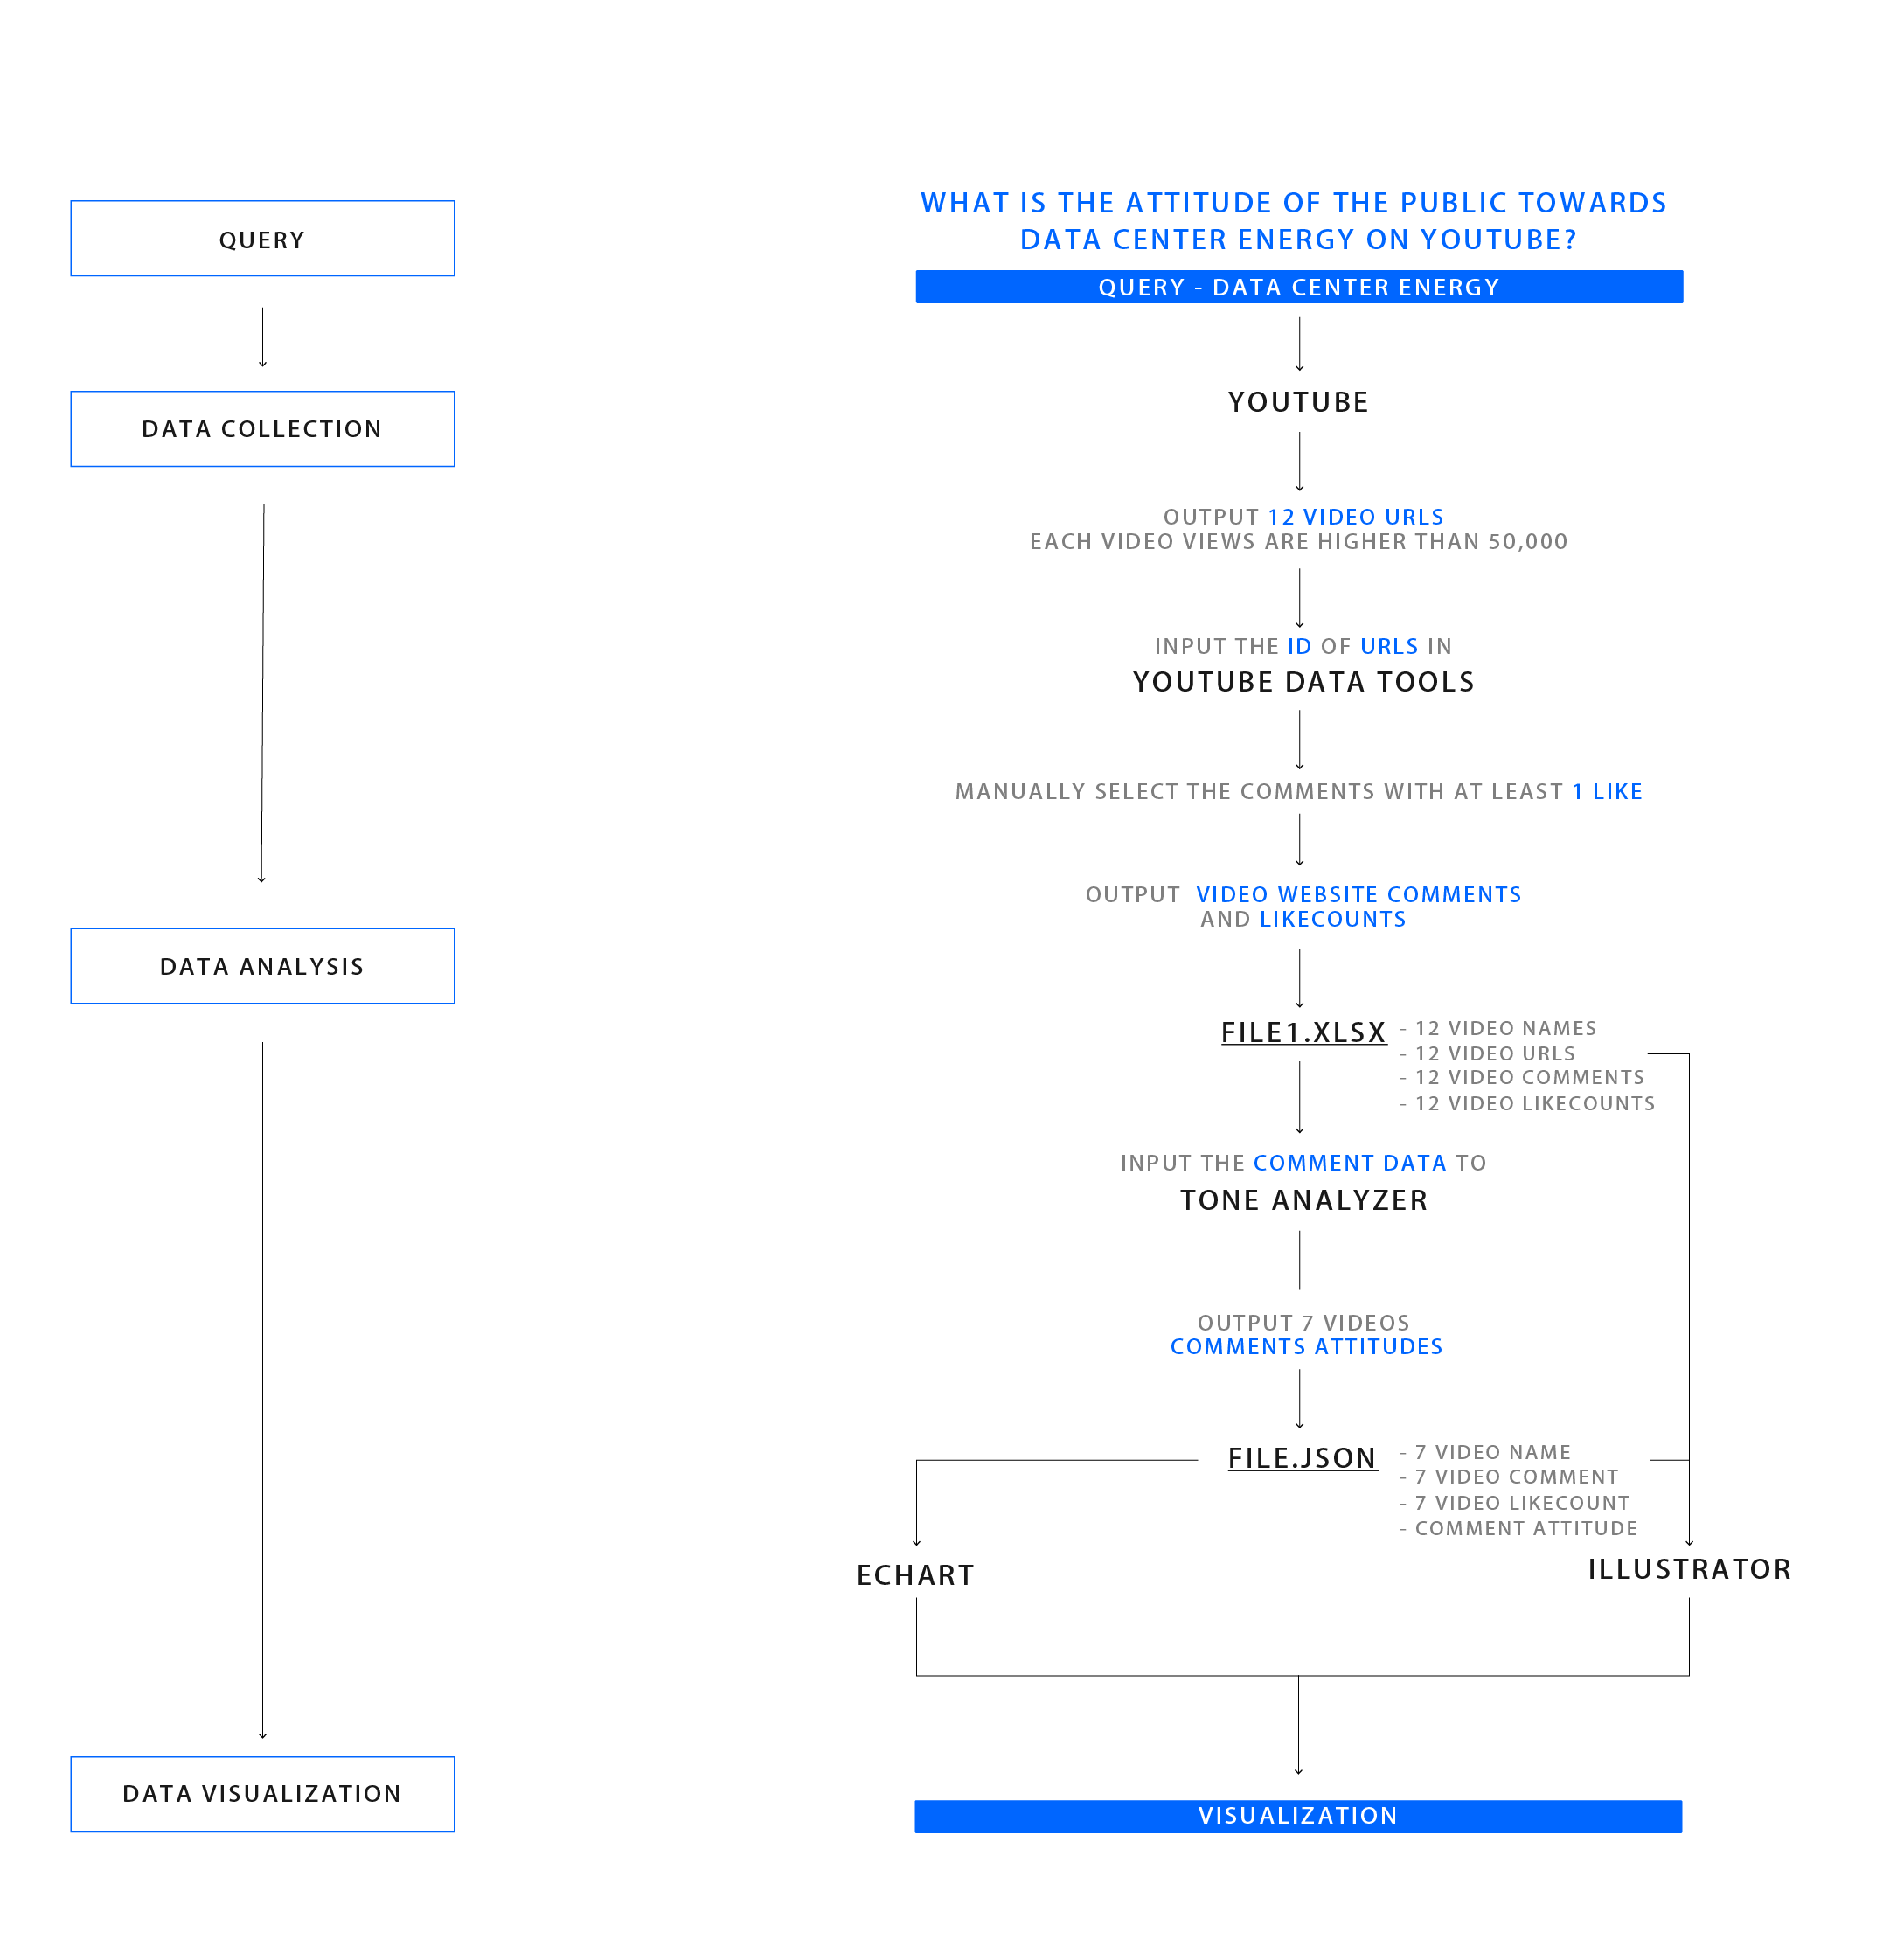
We used the YOUTUBE DATA TOOLS to get the comments from 12 videos on the YOUTUBE platform as datasets, and then filtered these through some certain condition and standard, removing the comments with 0 likes to get valid comments. After cleaning data,we retained nearly 7,000 comments and maked sentiment analysis with IBM TONE ANALYZER, whcih is a tool that effectively filters and classifies comments into seven emotion types. Finally, we import the Json file on ECHARTS (a data visualization tool developed by Baidu), and get visualization.
Data
Data Source: Youtube
Timestamp: 19/10/2018
View Data (147Kb)
This dataset was consisted of emotions, video IDs and comments. We use specific algorithm to output a new JSON file, expressing clearer hierarchy of the dataset.