Description
The visualization shows the history of editing of green computing from 2005 to the present in Wikipedia. It can be seen that the word was created in 2005, and its number of editing reached the most in February, April and May 2008. And 2008 is also the year with the highest annual editing volume. So we searched for important events and companies initiatives which took place between 2005 and 2009 through google, and labeled them on the chart. We can see that the company’s initiatives that emerged in 2008 are the most. At the same time, we also found some interesting connections. For example, the word ‘green computing’ was created in 2005, which happened to be the same year that the US Congress passed the EPA’s The Energy Policy Act of 2005 (Pub.L. 109–58). It changed US energy policy by providing tax incentives and loan guarantees for energy production of various types, and authorizes tax credits for wind and other alternative energy producers. According to the US EPA (United States Environmental Protection Agency) Report to Congress on Server and Data Center Energy Efficiency, the energy used by the nation’s servers and data centers is estimated that this sector consumed about 61 billion kilowatt-hours (kWh) in 2006 (1.5 percent of total US electricity consumption) for a total electricity cost of about $4.5 billion.
These events can explain why green computing is getting more and more attention in this time period, and it can be understood that people are paying increasingly attention to energy problems in data centers.
Protocol

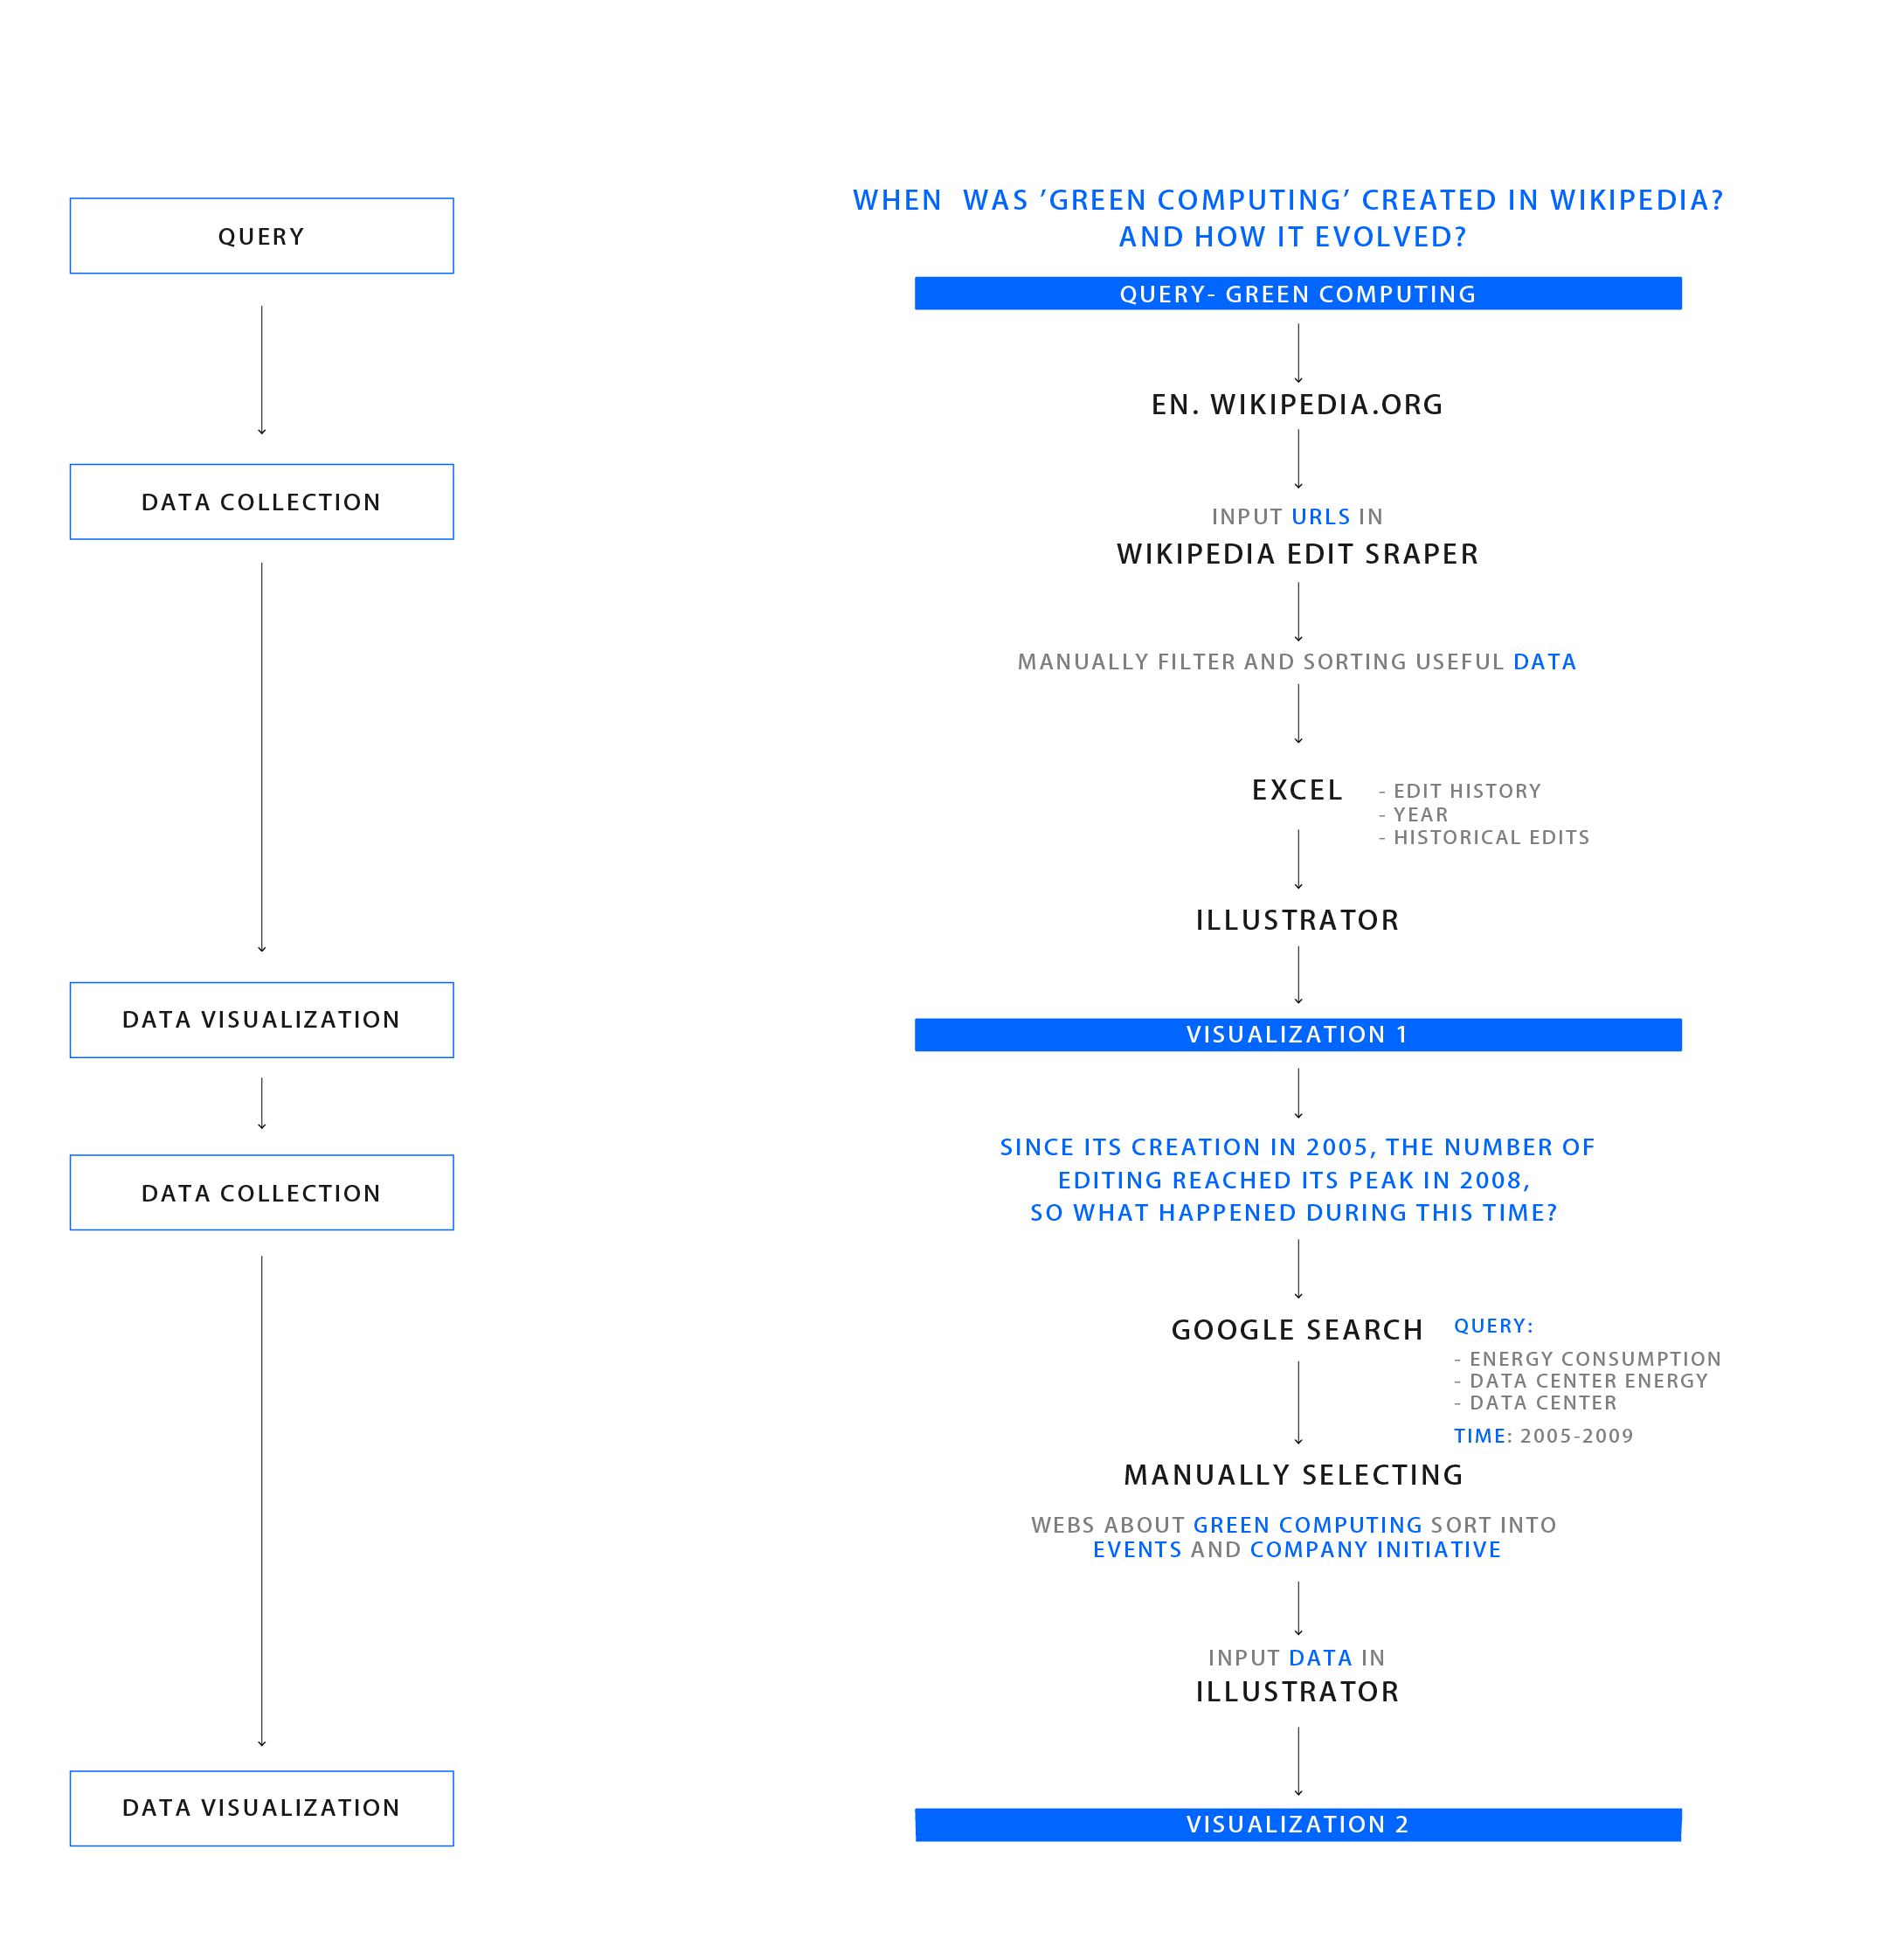
According to the previous protocol, we got the key node between ‘data center’ and ’energy conservation’ is ‘green computing’, we searched it in Wikipedia, then through WIKIPEDIA EDIT SRAPER we got its editorial history in Wikipedia. We manually filter and sorting useful data with excel, the visualization is made and improved by illustrator.
Then we found that since its creation in 2005, its number of editing reached its peak in 2008, so what happened during this time? Then we used GOOGLE SEARCH. QUERY: DATA CENTER ENERGY CONSUMPTION / DATA CENTER ENERGY / DATA CENTER. Manually select the relevant information from the top 100 websites between 2005 to 2009 and map them to the chart based on time.
Data
Data Source: GreenComputing
Timestamp: 19/10/2018
View Data (124Kb)
View Data (34Kb)
We used GOOGLE SEARCH QUERY: DATA CENTER ENERGY CONSUMPTION / DATA CENTER ENERGY / DATA CENTER then manually select the relevant information from the top 100 websites between 2005 to 2009 and made a list.