Description
Against our expectations, the highest peak of views was registered by the Japanese page in June 2016: thanks to Google Trends we discovered that this huge interest for Hate Speech was probably caused by the resonance of the Anti-Korean hate speech rally that was called off in Kawasaki amid protests on June 5, 2016, which came shortly after the “Hate Speech Act” that passed in Japan on May 25, 2016. The two other visible peaks correspond to the Charlottesville attack in the US which took place in August 11-12, 2017, and to the cancellation of the Anime adaptation of ‘Young Again in Another World’ in Japan on June 6, 2018 after past discriminatory tweets by author Mine on China and South Korea had sparked controversy.
We decided to focus on the views peaks after having analyzed the peaks of edits of the Hate Speech Wikipedia pages in protocol 2.1. Therefore, this visualization was designed in order to put in relation the peaks of views per month on the Wikipedia pages about Hate Speech in the last three years, to the events that may have caused them due to their public resonance, clarifying the fact that manifestations of hate and violence have direct consequences on public interest about hate speech, since people tend to look for information about it after these kind of events in order to better understand this complex phenomenon.
As it’s evident from the graph there are two pages that stand out: the Hate Speech English page was the most viewed counting a total of a little bit more than a million views, and it corresponds to the orange line; the Hate Speech Japanese page follows closely, and it corresponds to the blue line. All the others Wikipedia languages that have a Hate Speech page are displayed on the top right of the visualization in decreasing order: as it’s clear from the amounts of the other Wikipedia Hate Speech pages, the other languages are not comparable with the first two, so we decided to sum them up in one lilac line and consider only the total month average. All the languages listed are clickable as they link to the relative Wikipedia page. As the mouse explores the graph the precise values of the views peaks are shown.
Protocol
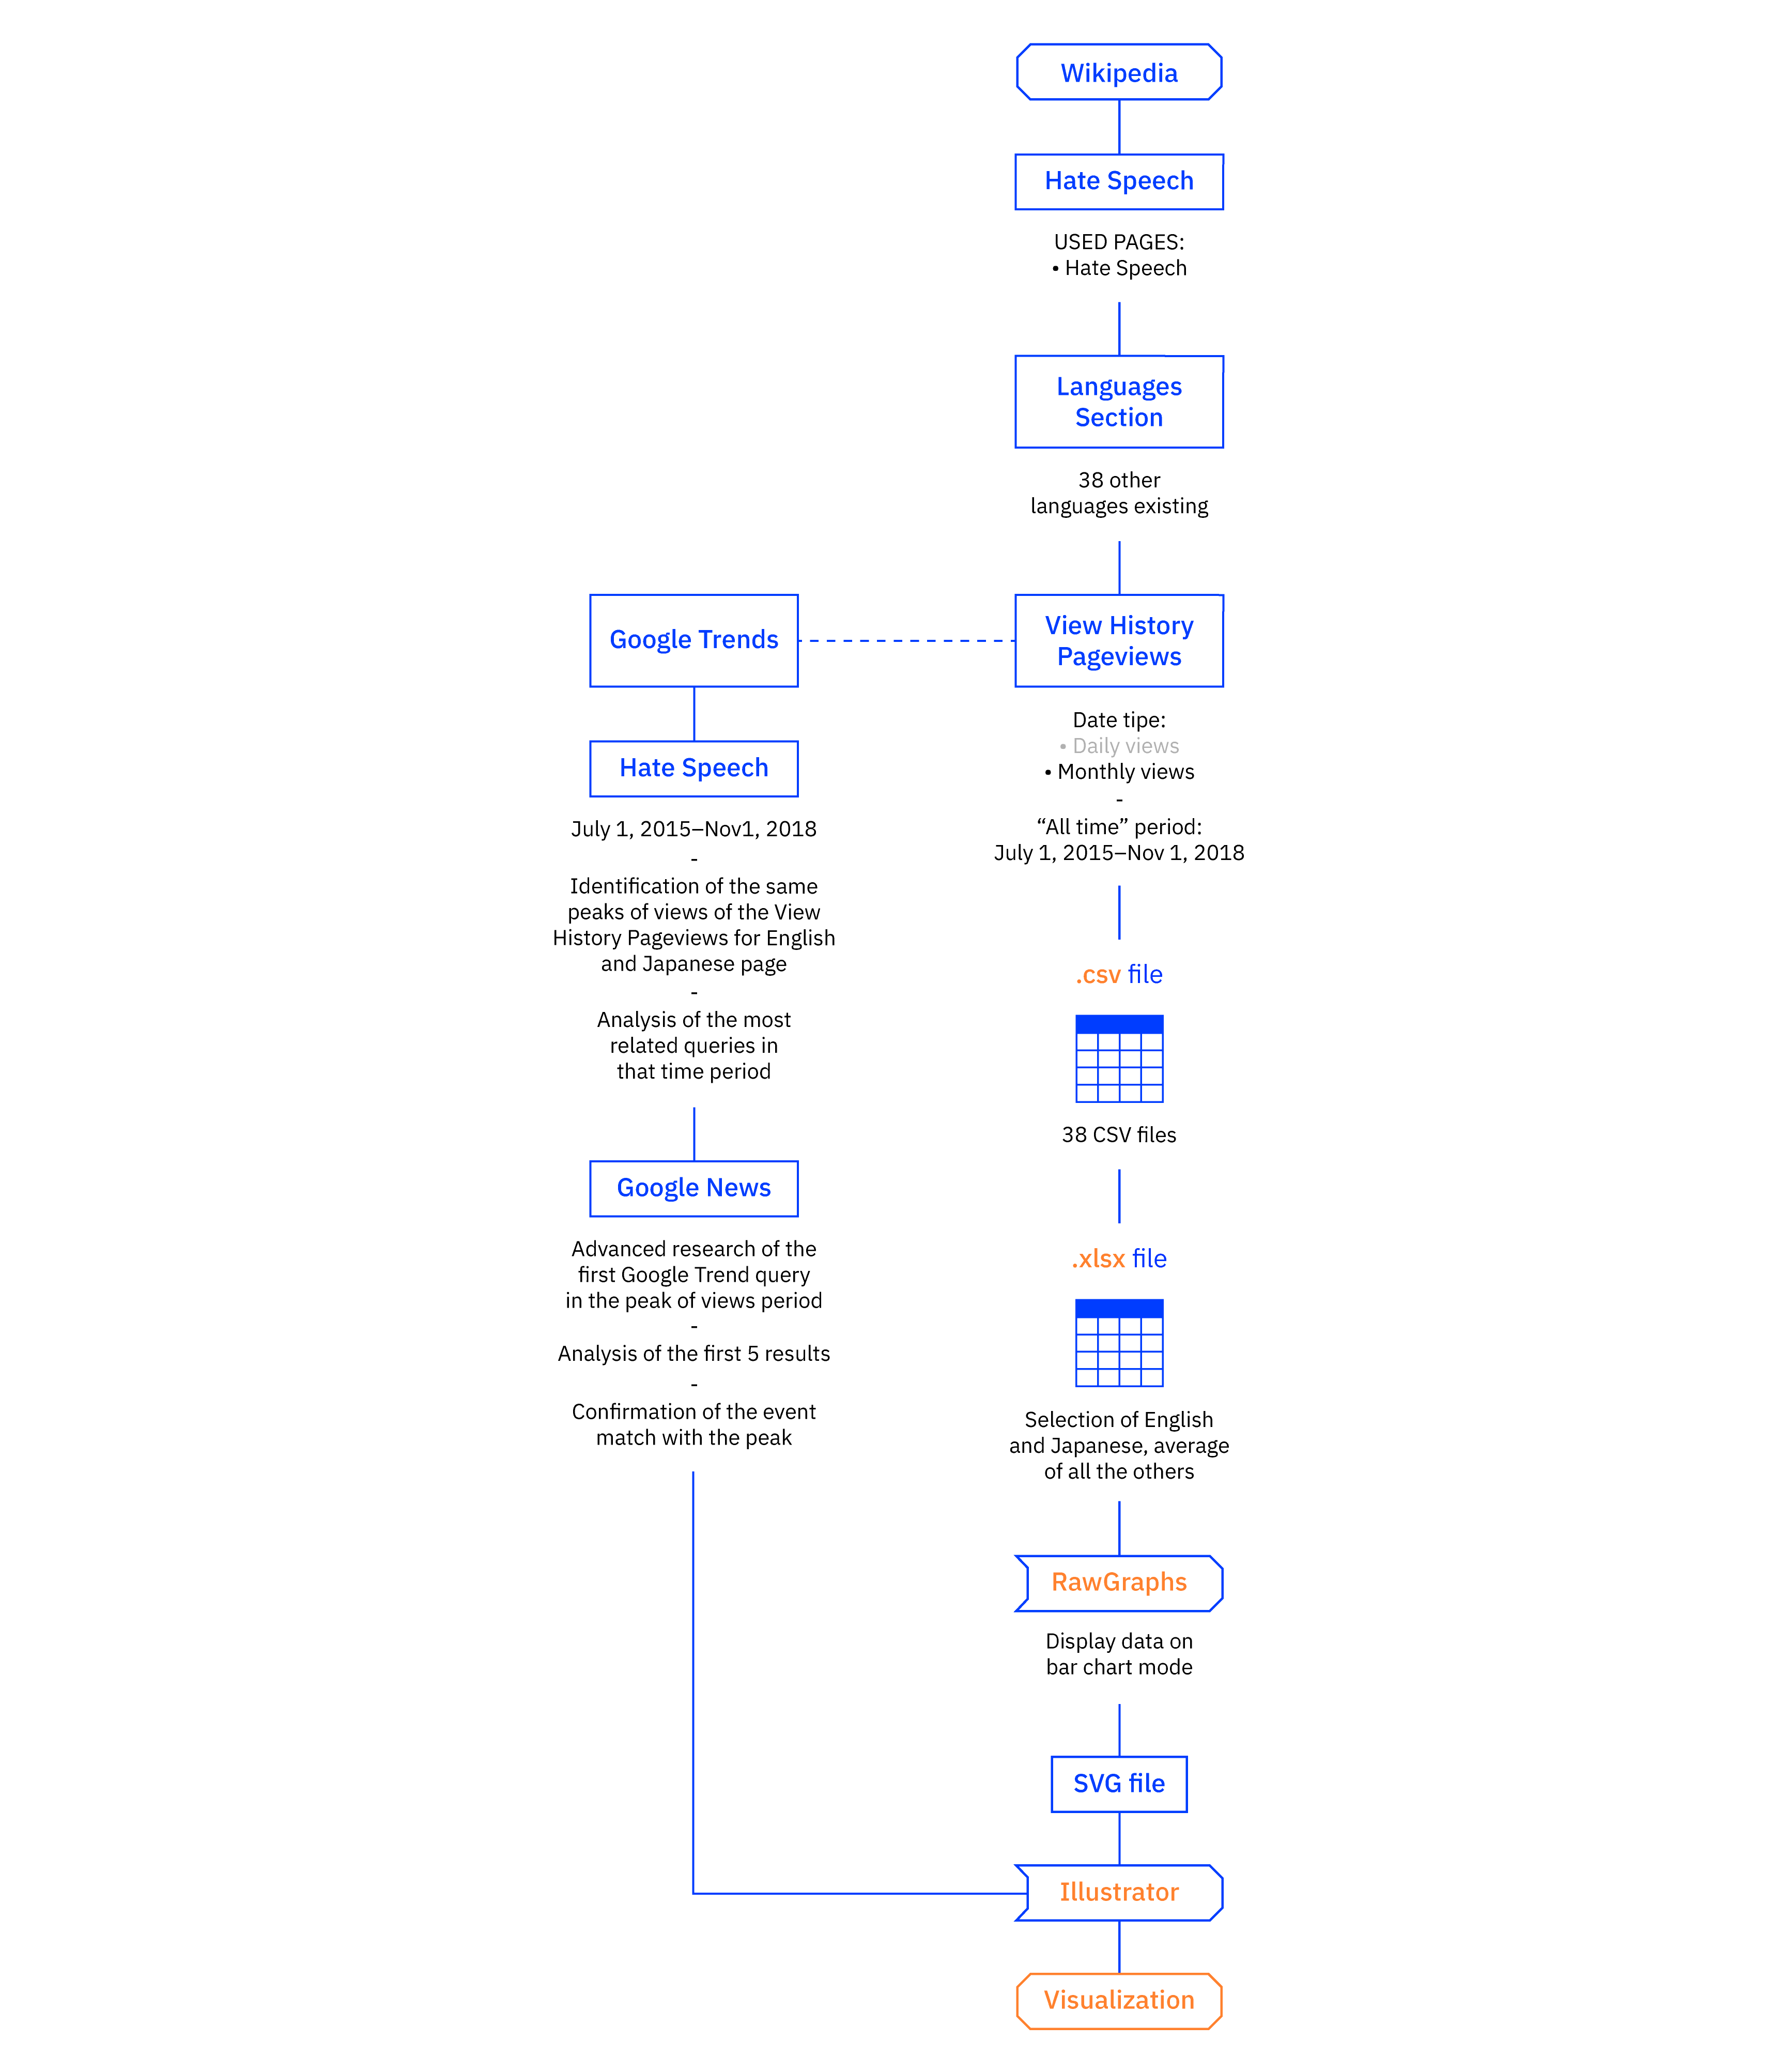
At first, we collected the data of the number of views per month for the Hate Speech page of each Wikipedia language. This information was manually scraped and organized in an Excel file from the “View History - Pageviews” section (Wikimedia Tool Forge-Langviews Analysis), selecting the “all time” period (so, since July 1, 2015 to October 31, 2015). We later organized the pages in decreasing order of views to compare them and to understand which were the most viewed and when there were peaks of visualizations.
After having analyzed our Excel file, we decided to focus only on the English and the Japanese pages since they have been the most viewed in the last three years, discarding all the languages that were below 100k views in total. At this point, we started looking for specific events that may have caused specific peaks of views for the English and the Japanese page. To do so, we used Google Trends: we started by identifying the peaks in Google searches for “hate speech” in the same time period in the specific countries (US and Japan) for the English and the Japanese language; then, we checked if the these peaks matched with the ones of the views of Hate Speech on Wikipedia. Then, we analyzed the most related queries on Google Trends and made an advanced research on Google News of the first query in that same specific time period. Afterwards, we analyzed the first five results to confirm the event that was associated with the peak. The final Excel file was then uploaded to RawGraphs in order to start displaying the data on bar chart mode; the resulting SVG file was later refined with Adobe Illustrator.