Description

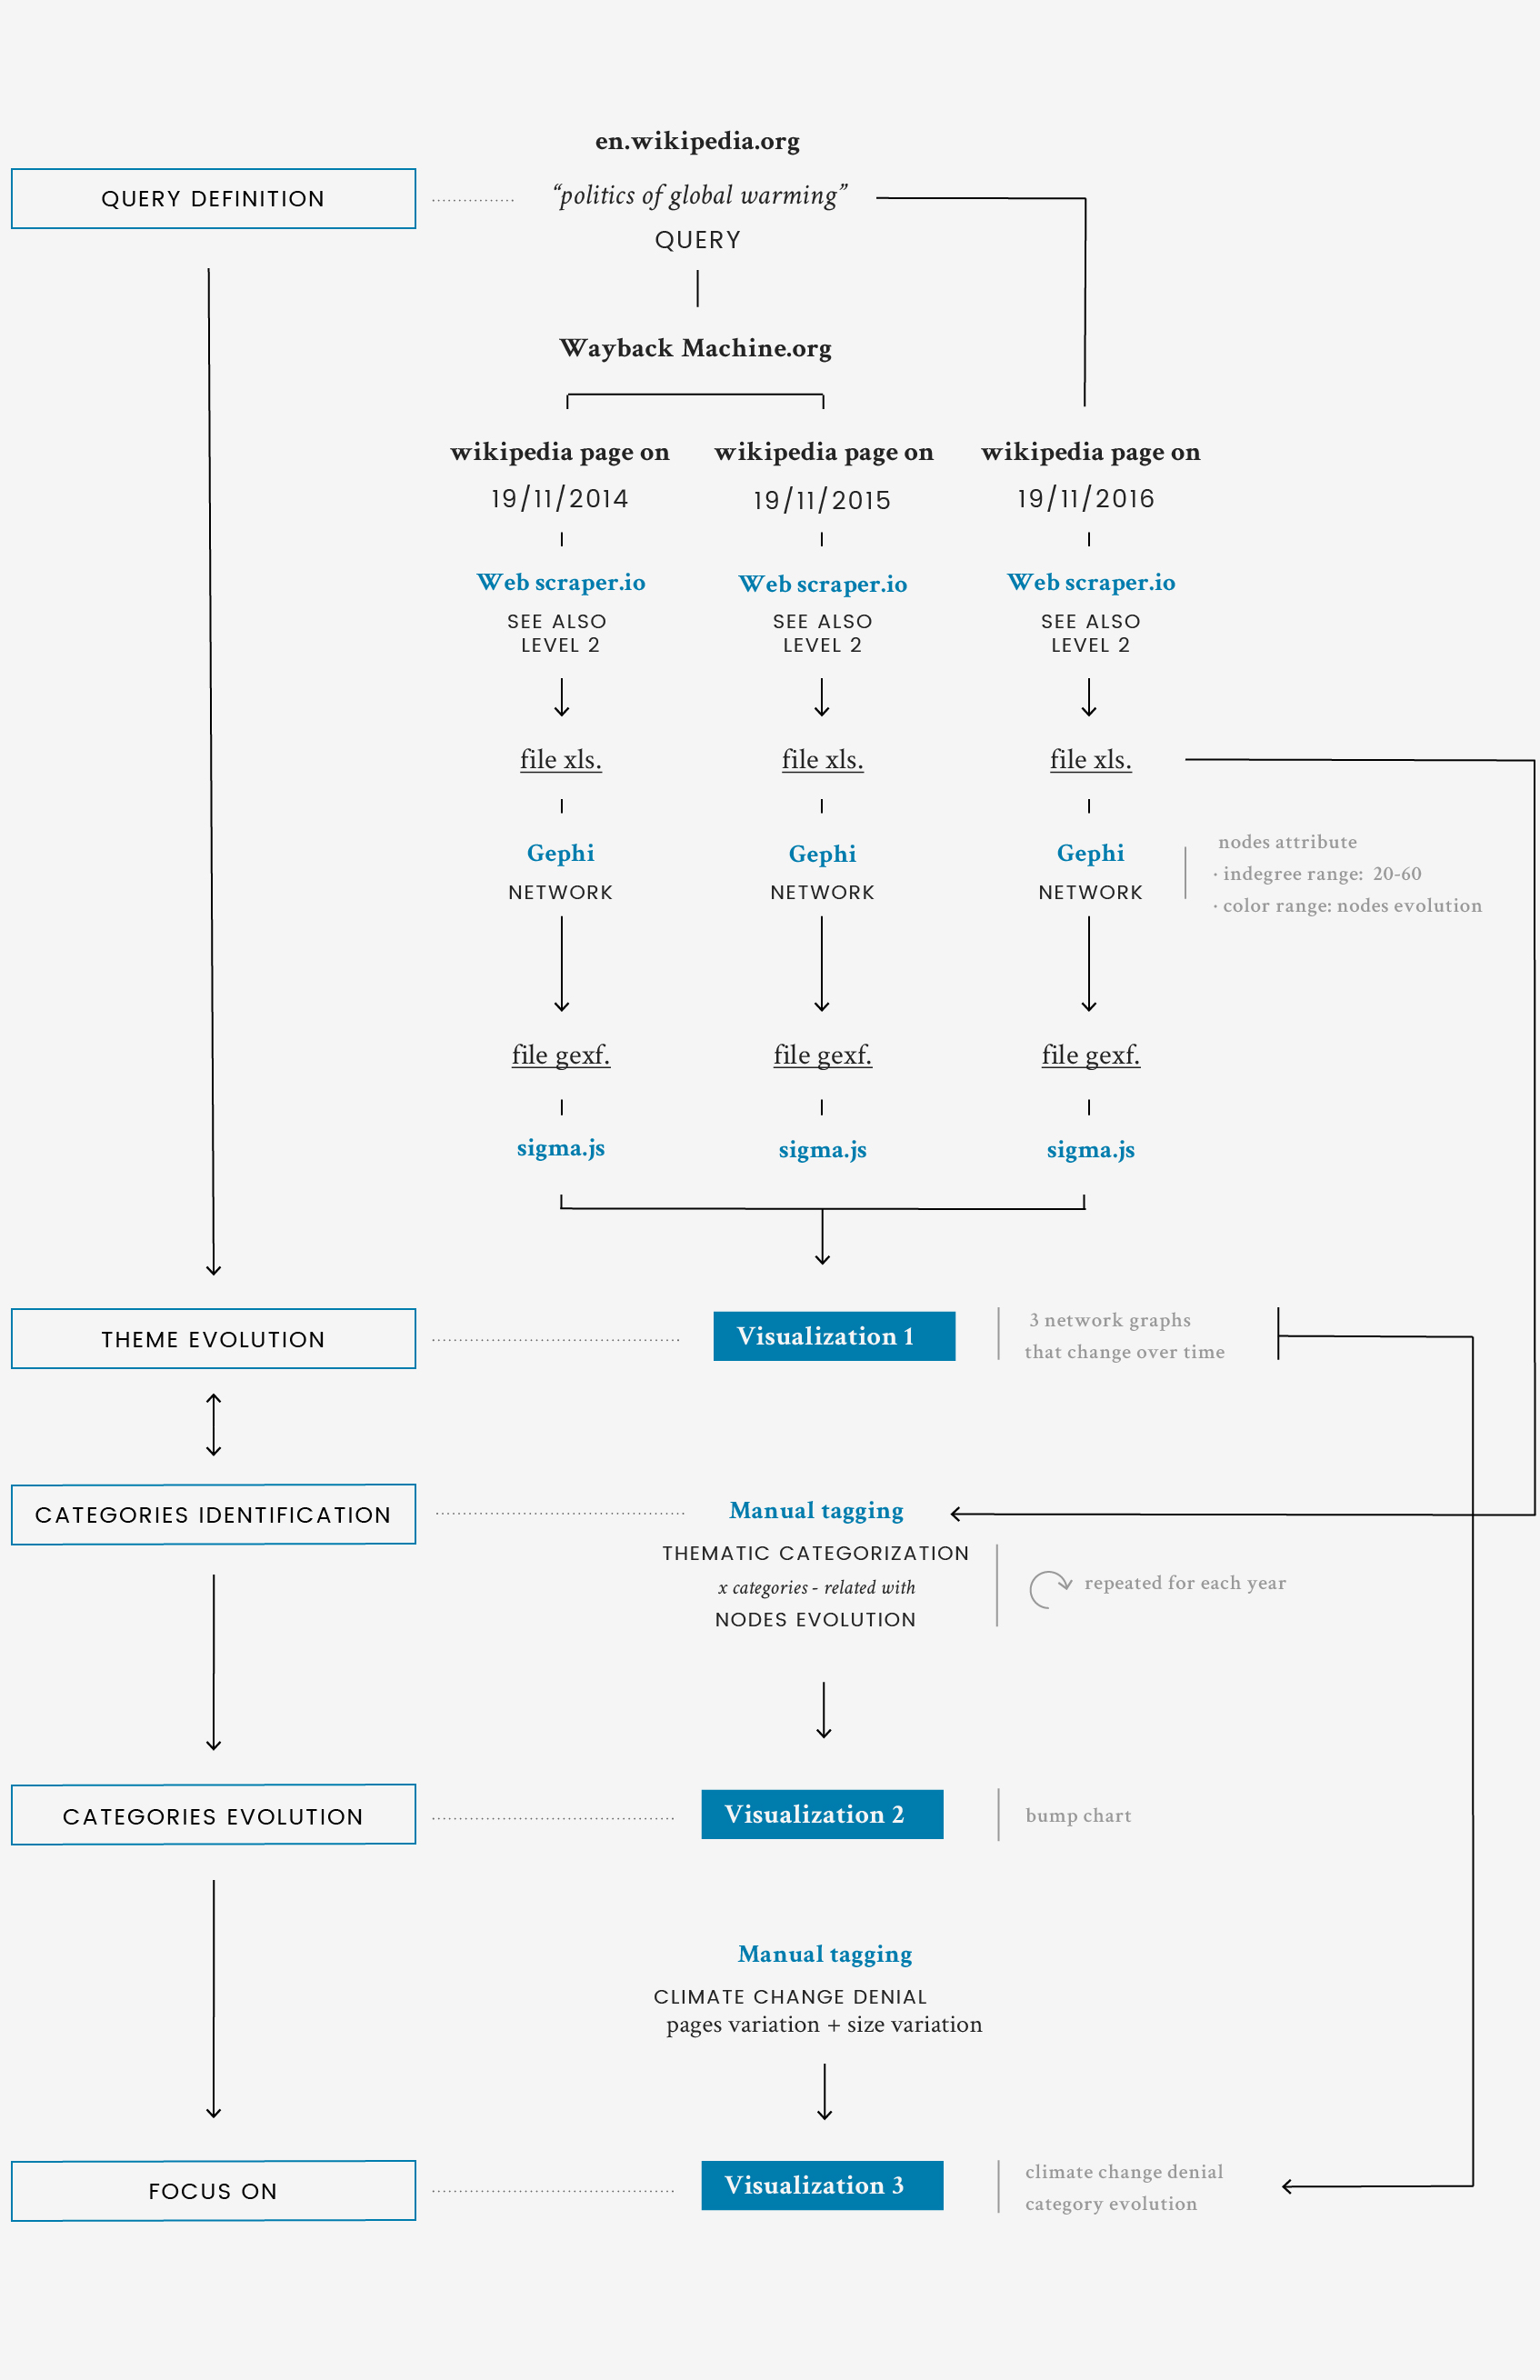
Before focusing on a specific time or location it was necessary to have a global understanding of the political debate that revolves around climate change. For this reason the networks showed analyze the Wikipedia page called “Politics of global warming”.They represent all topics related to the chosen item, during three years.

Each node is a Wikipedia page and it is represented in different colors, according to the node evolution. Each page is categorized by subjects and the alluvial diagram shows the quantitative evolution of each page and each subject through time. Some categories are almost unchanged. It’s the case of meeting, which occupies steadily the high-end of the graphics.

During the three years has changed not only the distribution of the subjects, but also the overall number of items related to the main seed. In particular, it highlights during each year the relationship between existing pages, new pages and erased pages. 2016 seems to have been a particularly important year for the political discussion around climate change, because many entries have been added within Wikipedia. Furthermore, the “see also” pages connected to the “Climate change denial” page are changed remarkably. First of all, in 2016 to a subsection of the page “Political position of Donald trump”, referred to his positions about climate change, has appeared. Secondly, we can see a thematic transition from the scientific area to the political and mediatic areas.

Climate change denial: nodes evolution

Protocol

For a first comprehensive exploration of the topic, the research took place on Wikipedia, since it is one of the largest online encyclopedia. Since the aim was to investigate the political side of climate change debate, the main seed of the search was the page "Politics of global warming". Other generic queries, such as "climate change" or "global warming", produced a way too large body of results to be relevant in the context of the current research.

By using the Seealsology tool, the extraction of all the related pages was conducted for the year 2016. Since the results were quite promising, the next step was to investigate also the previous two years, in order to see if there were any changes in the articulation of the debate.

The exploration of 2014 and 2015 required two steps: WayBack Machine, in order to browse Wikipedia website of two years ago, and Web Scraper.io, in order to rebuild the network of pages. Using Gephi the three maps of related topics were created. At a later time, the collected items were manually categorized by subjects and analyzed individually in their temporal evolution. Three stages of nodes evolution have been highlighted: existing pages, added pages and deleted pages through years. This allowed to better understand how the debate was articulated through time.

Data

Data source: Wikipedia, Webscraper, Seealsology, Webarchive.org

While Seealsology allowed the scraping of current Wikipedia, the scraping of the See Also connection for Wikipedia pages in the past needed another way to gather the data.
The result is a network of pages connected one to another. Each page is tagged with its status, that was then recollected in a pivot table used to draw the second visualization.