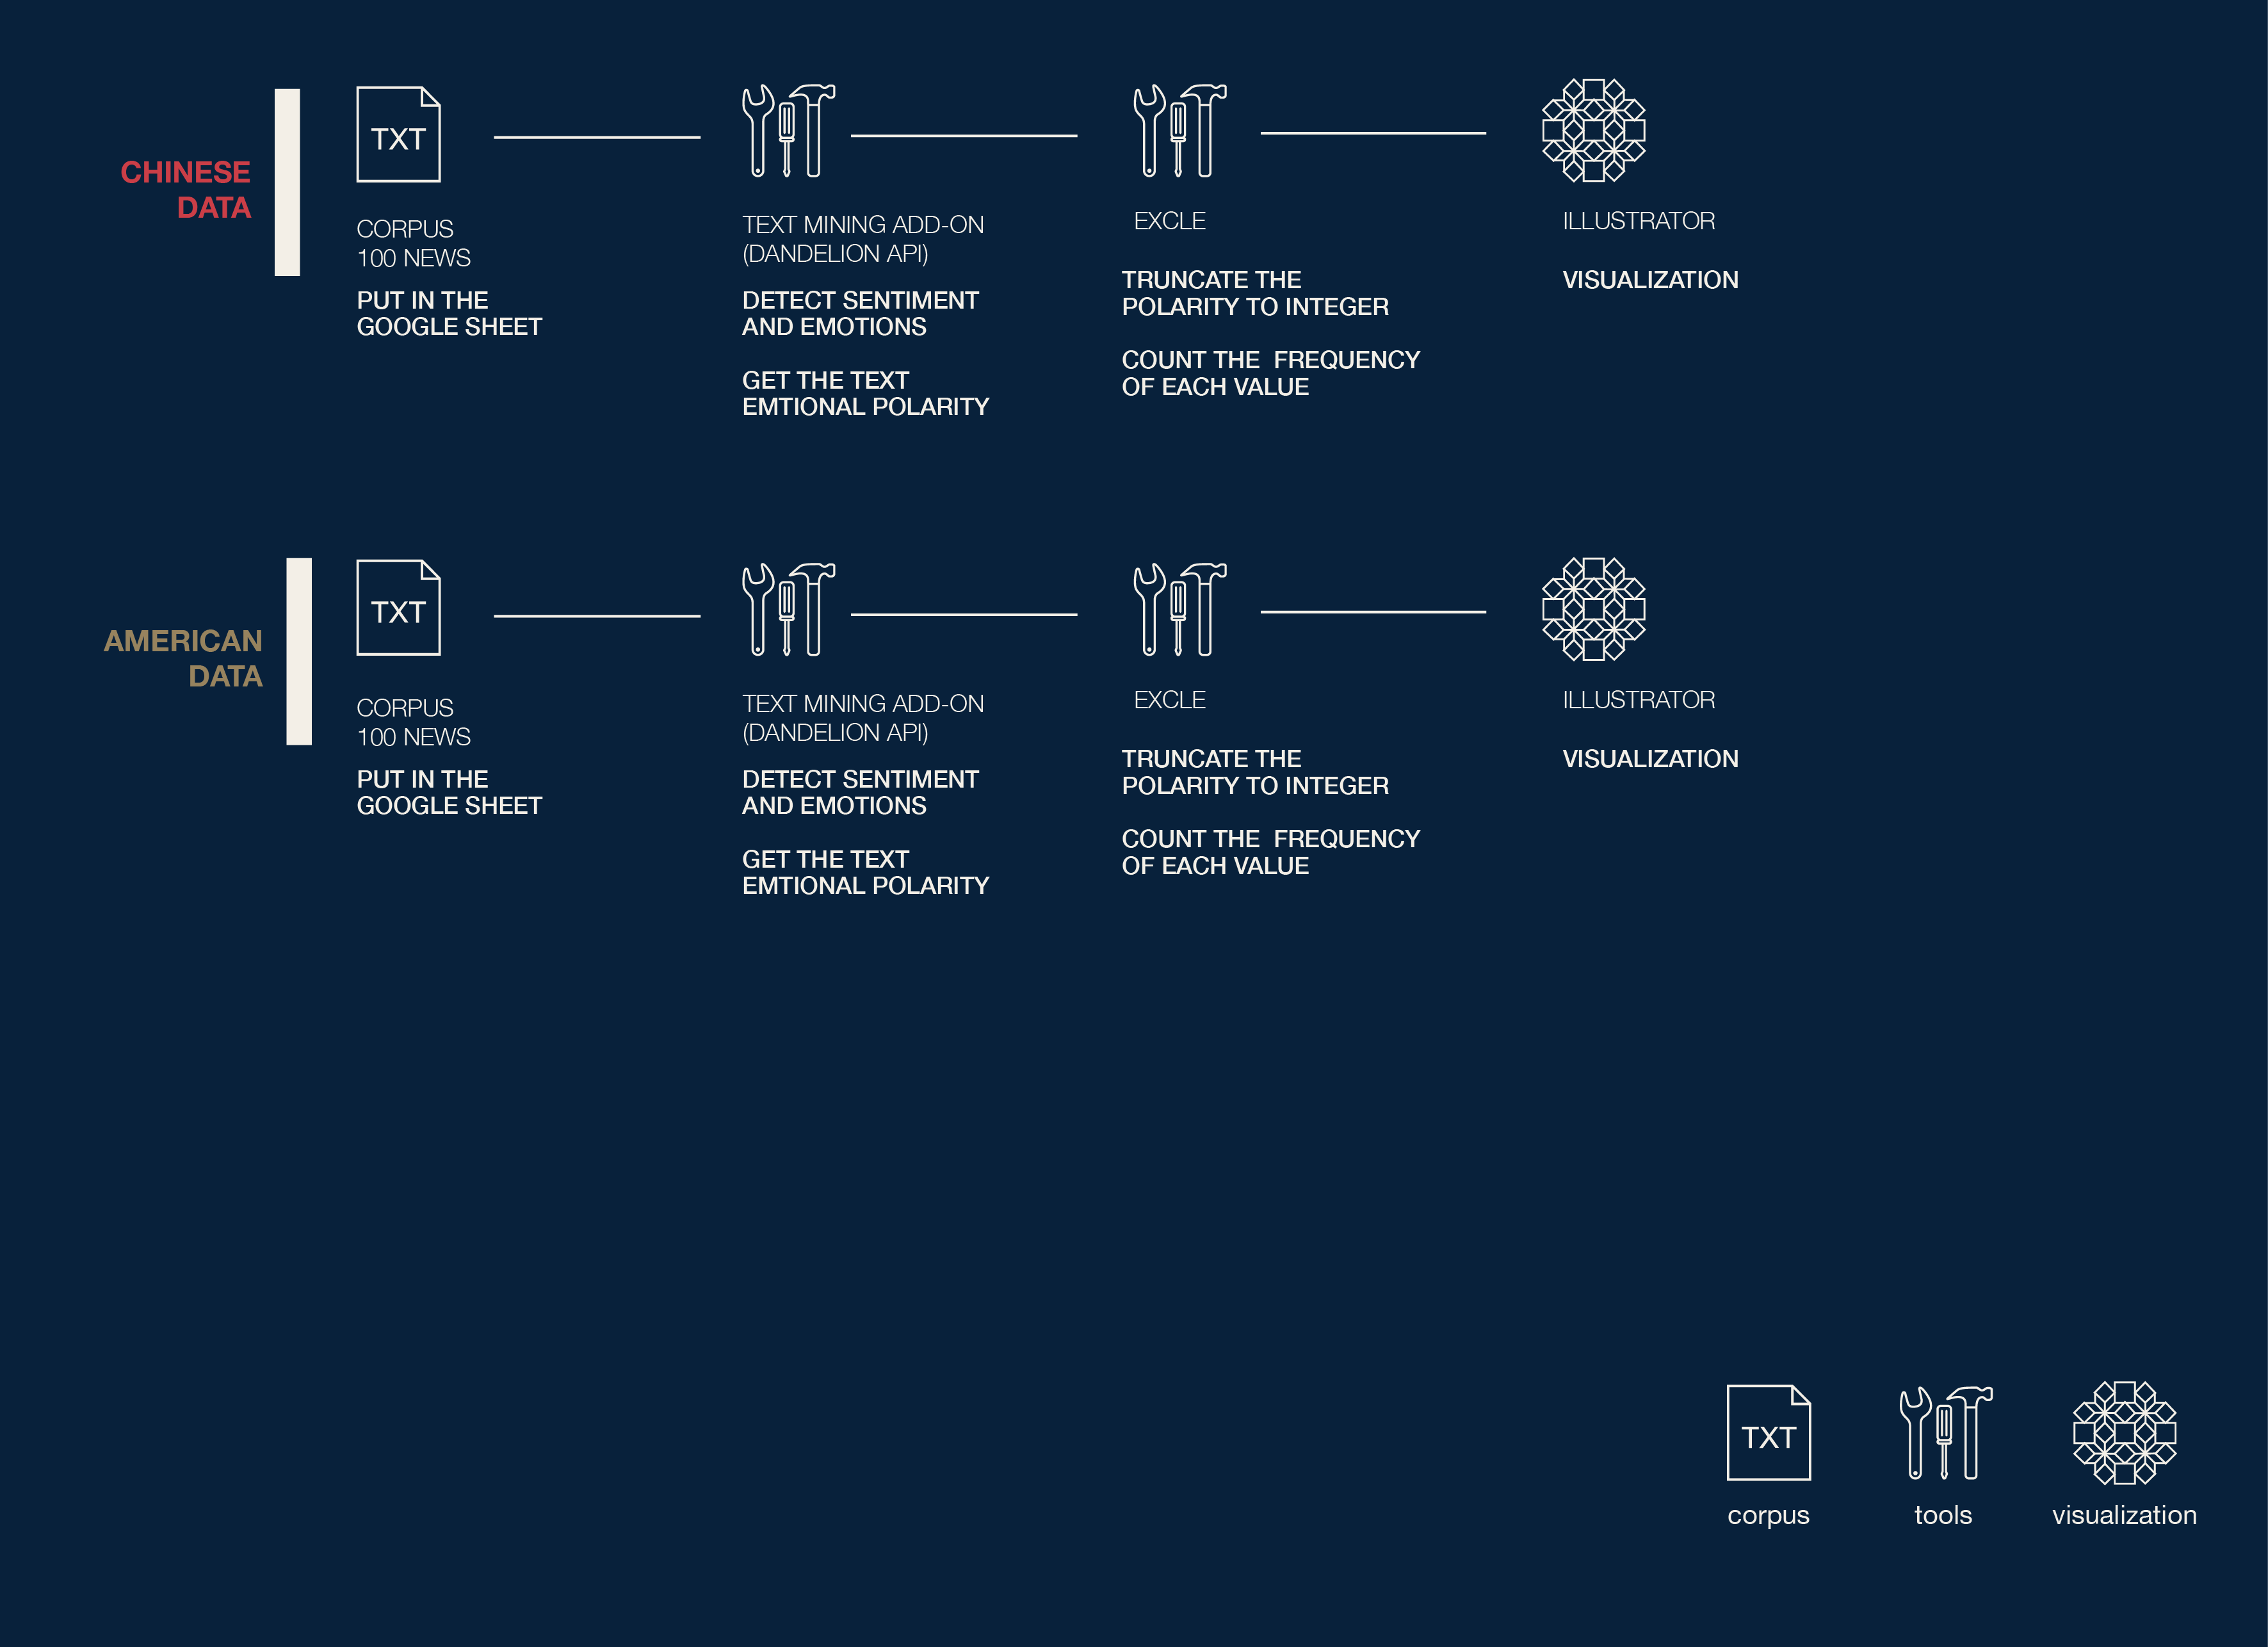
Description
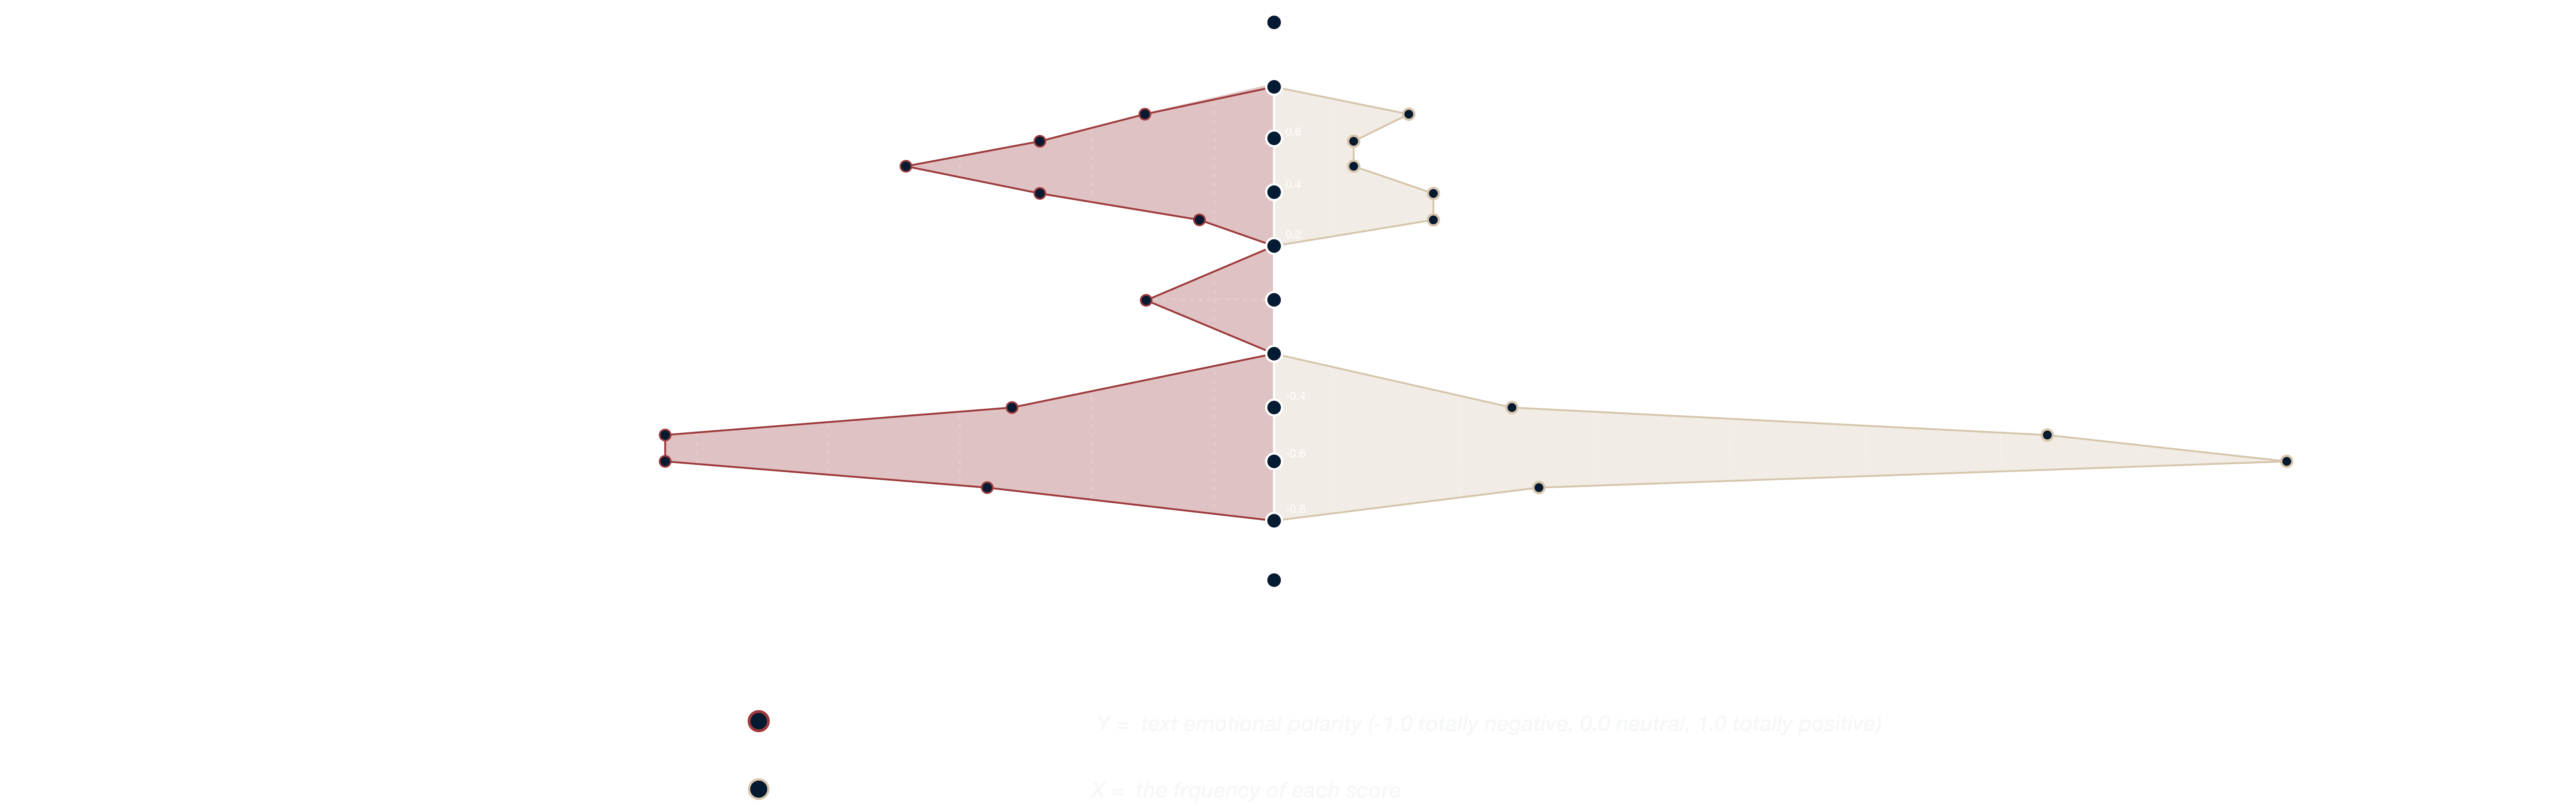
The final step of this section is about the sentiment analysis of the 200 news we chose. in the diagram, the value on the vertical axis is the text emotional polarity (-1 totally negative, 0 neutral, 1 totally positive.). The value on the horizontal axis represent the times that each polarity appears.
In the diagram, we can see most of the reports on both sides all have a negative attitude about climate change. but in another hand, china have more positive news than United states has.