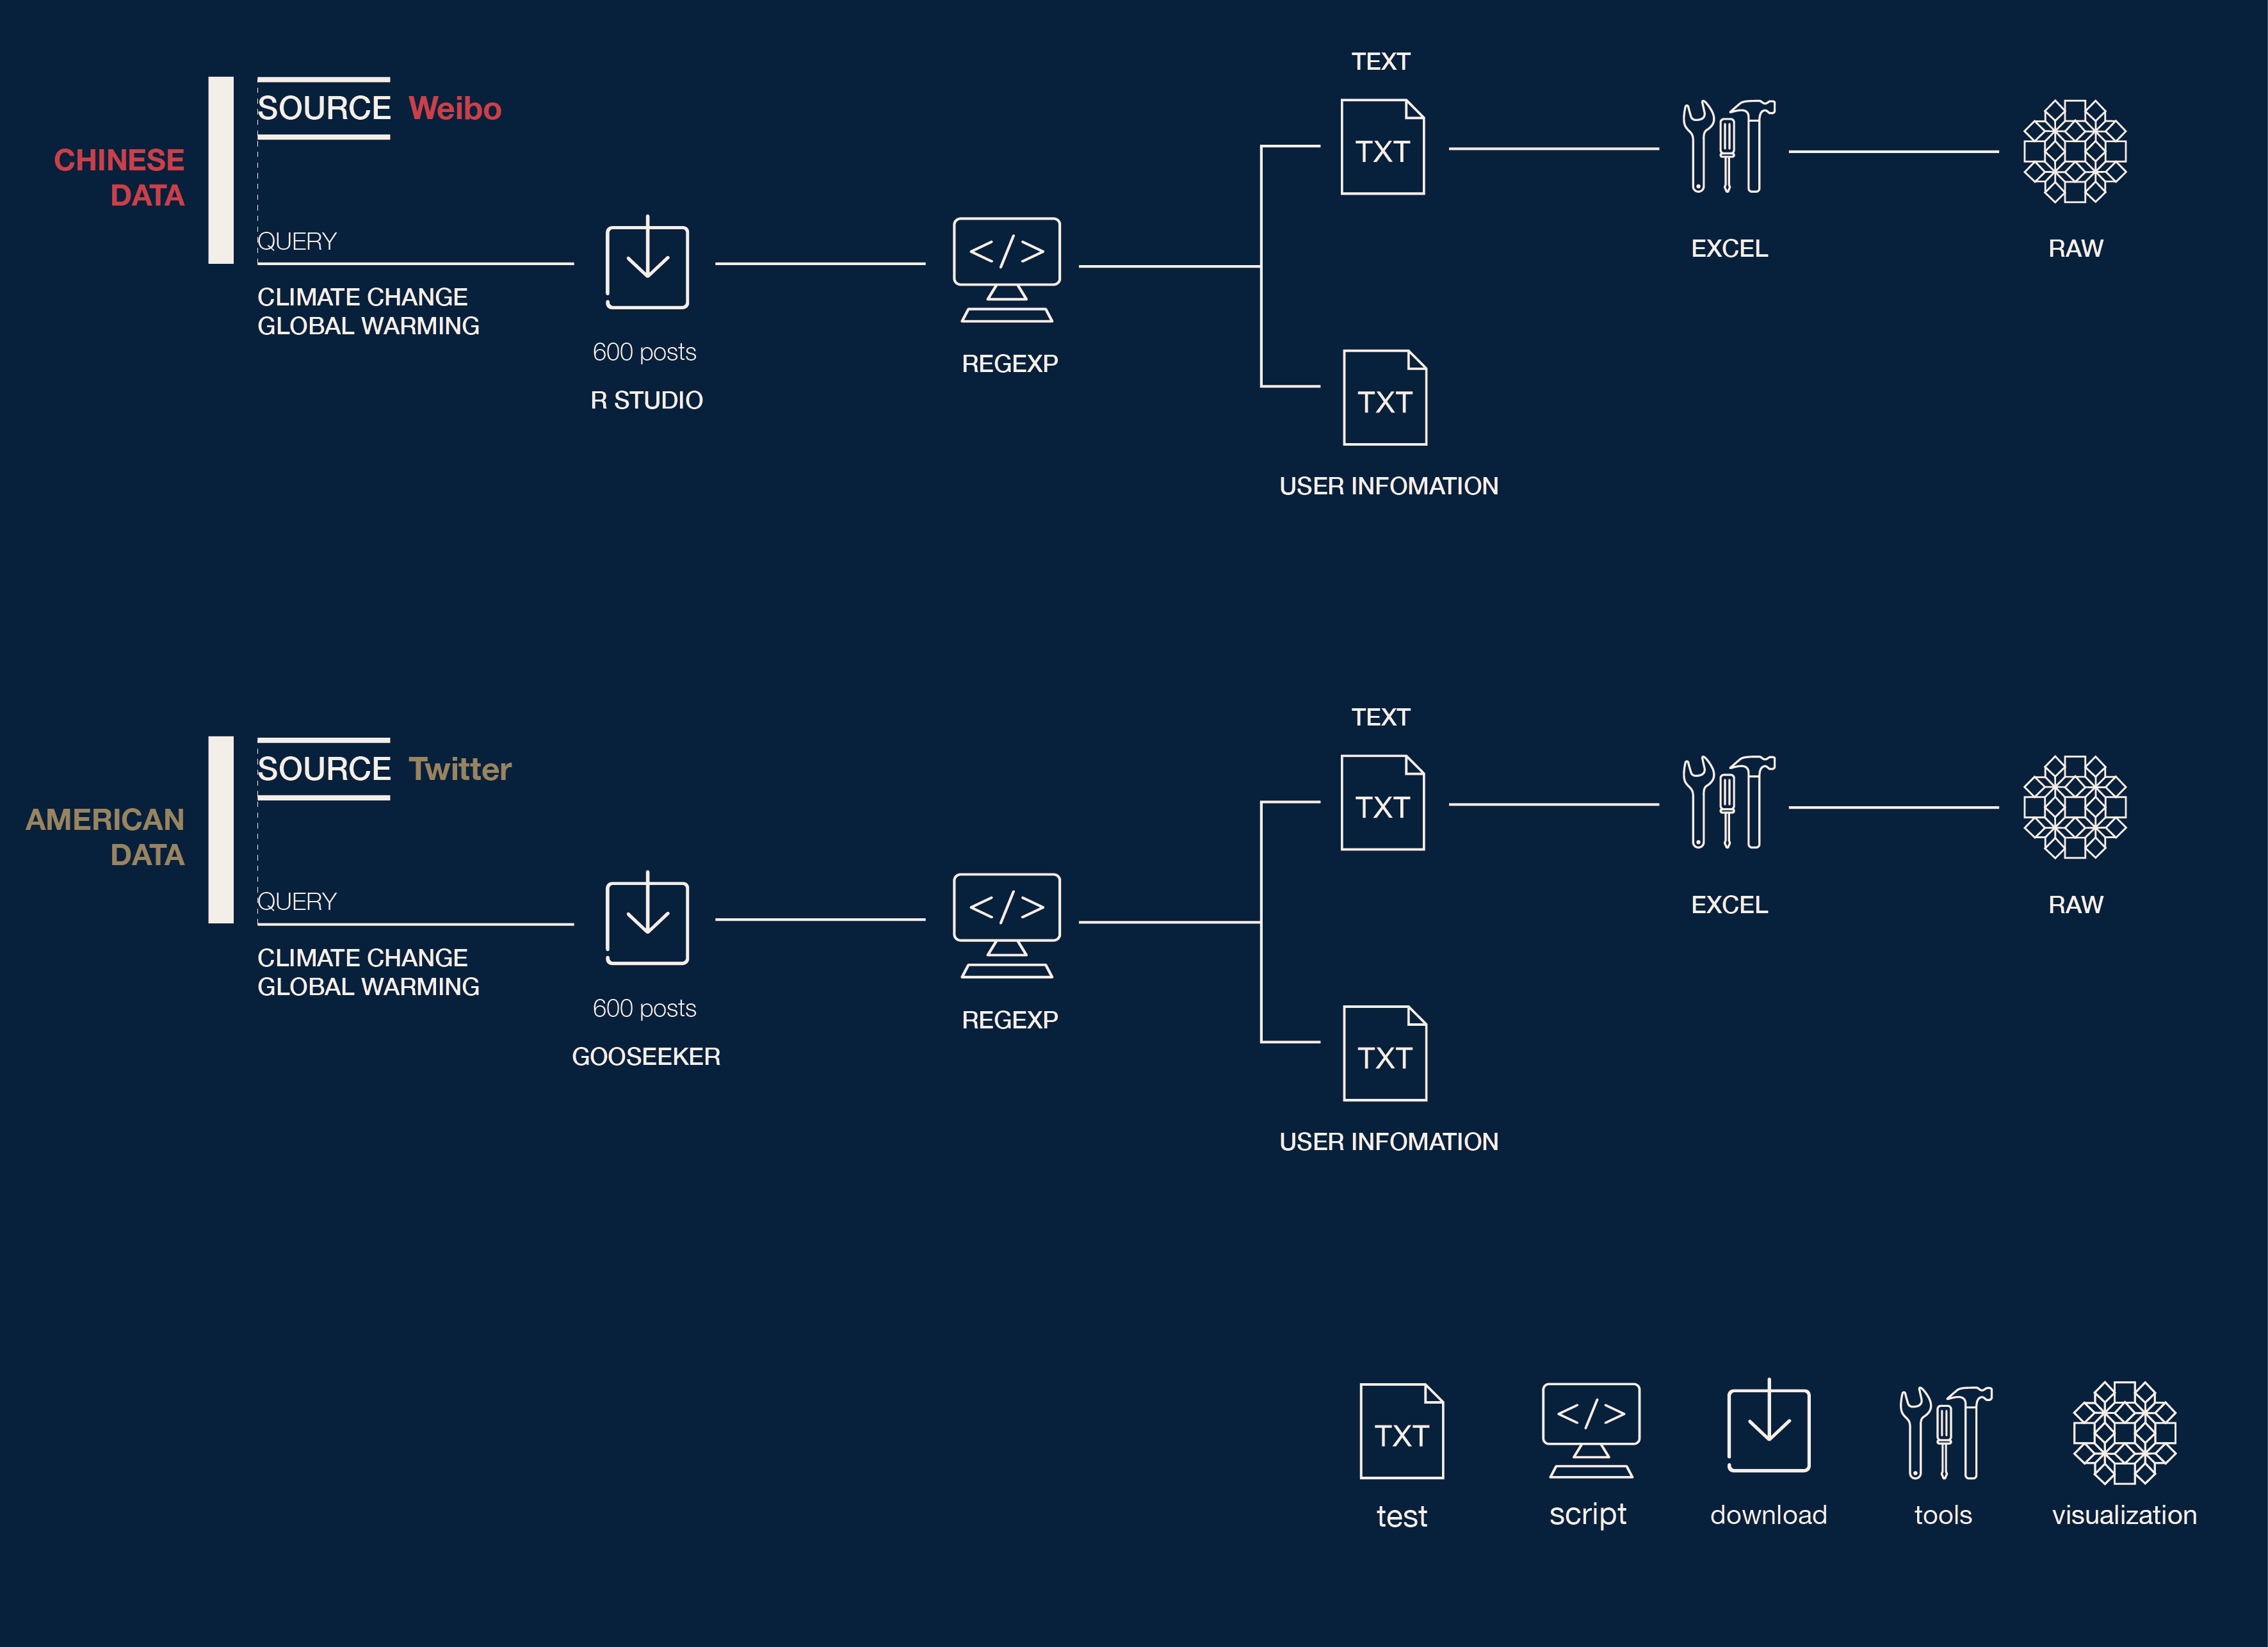
Description
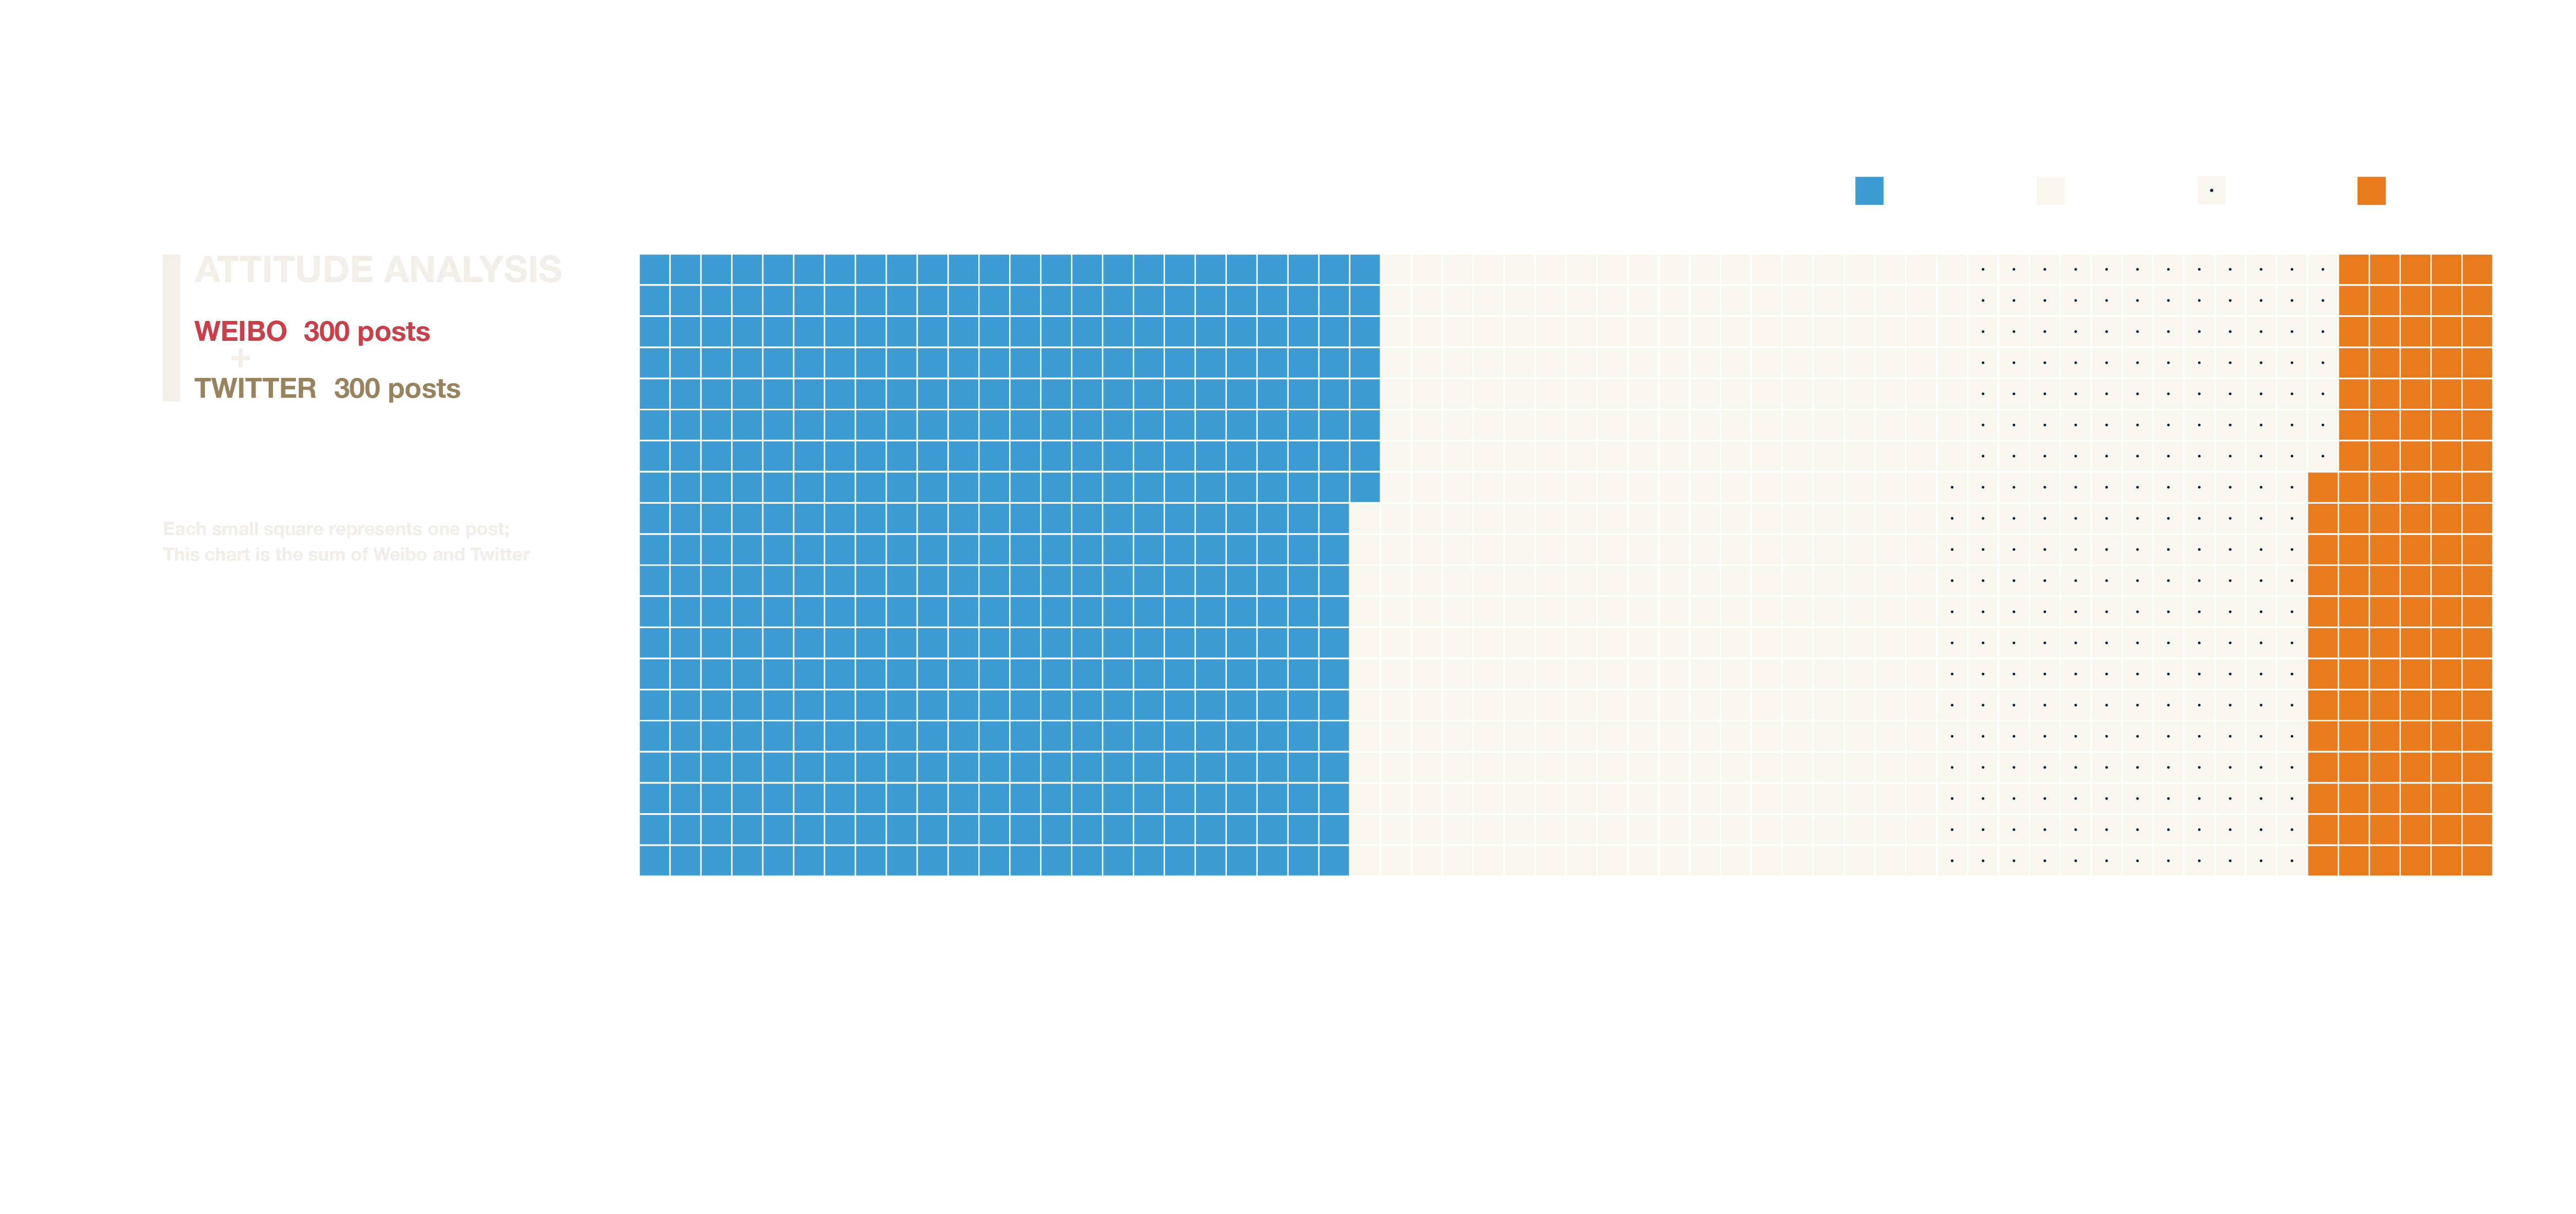
In the final section, we try to analyze the users' attitudes towards global warming and climate change based on the text,How are distributed the polarizations within the different topics and different platform.
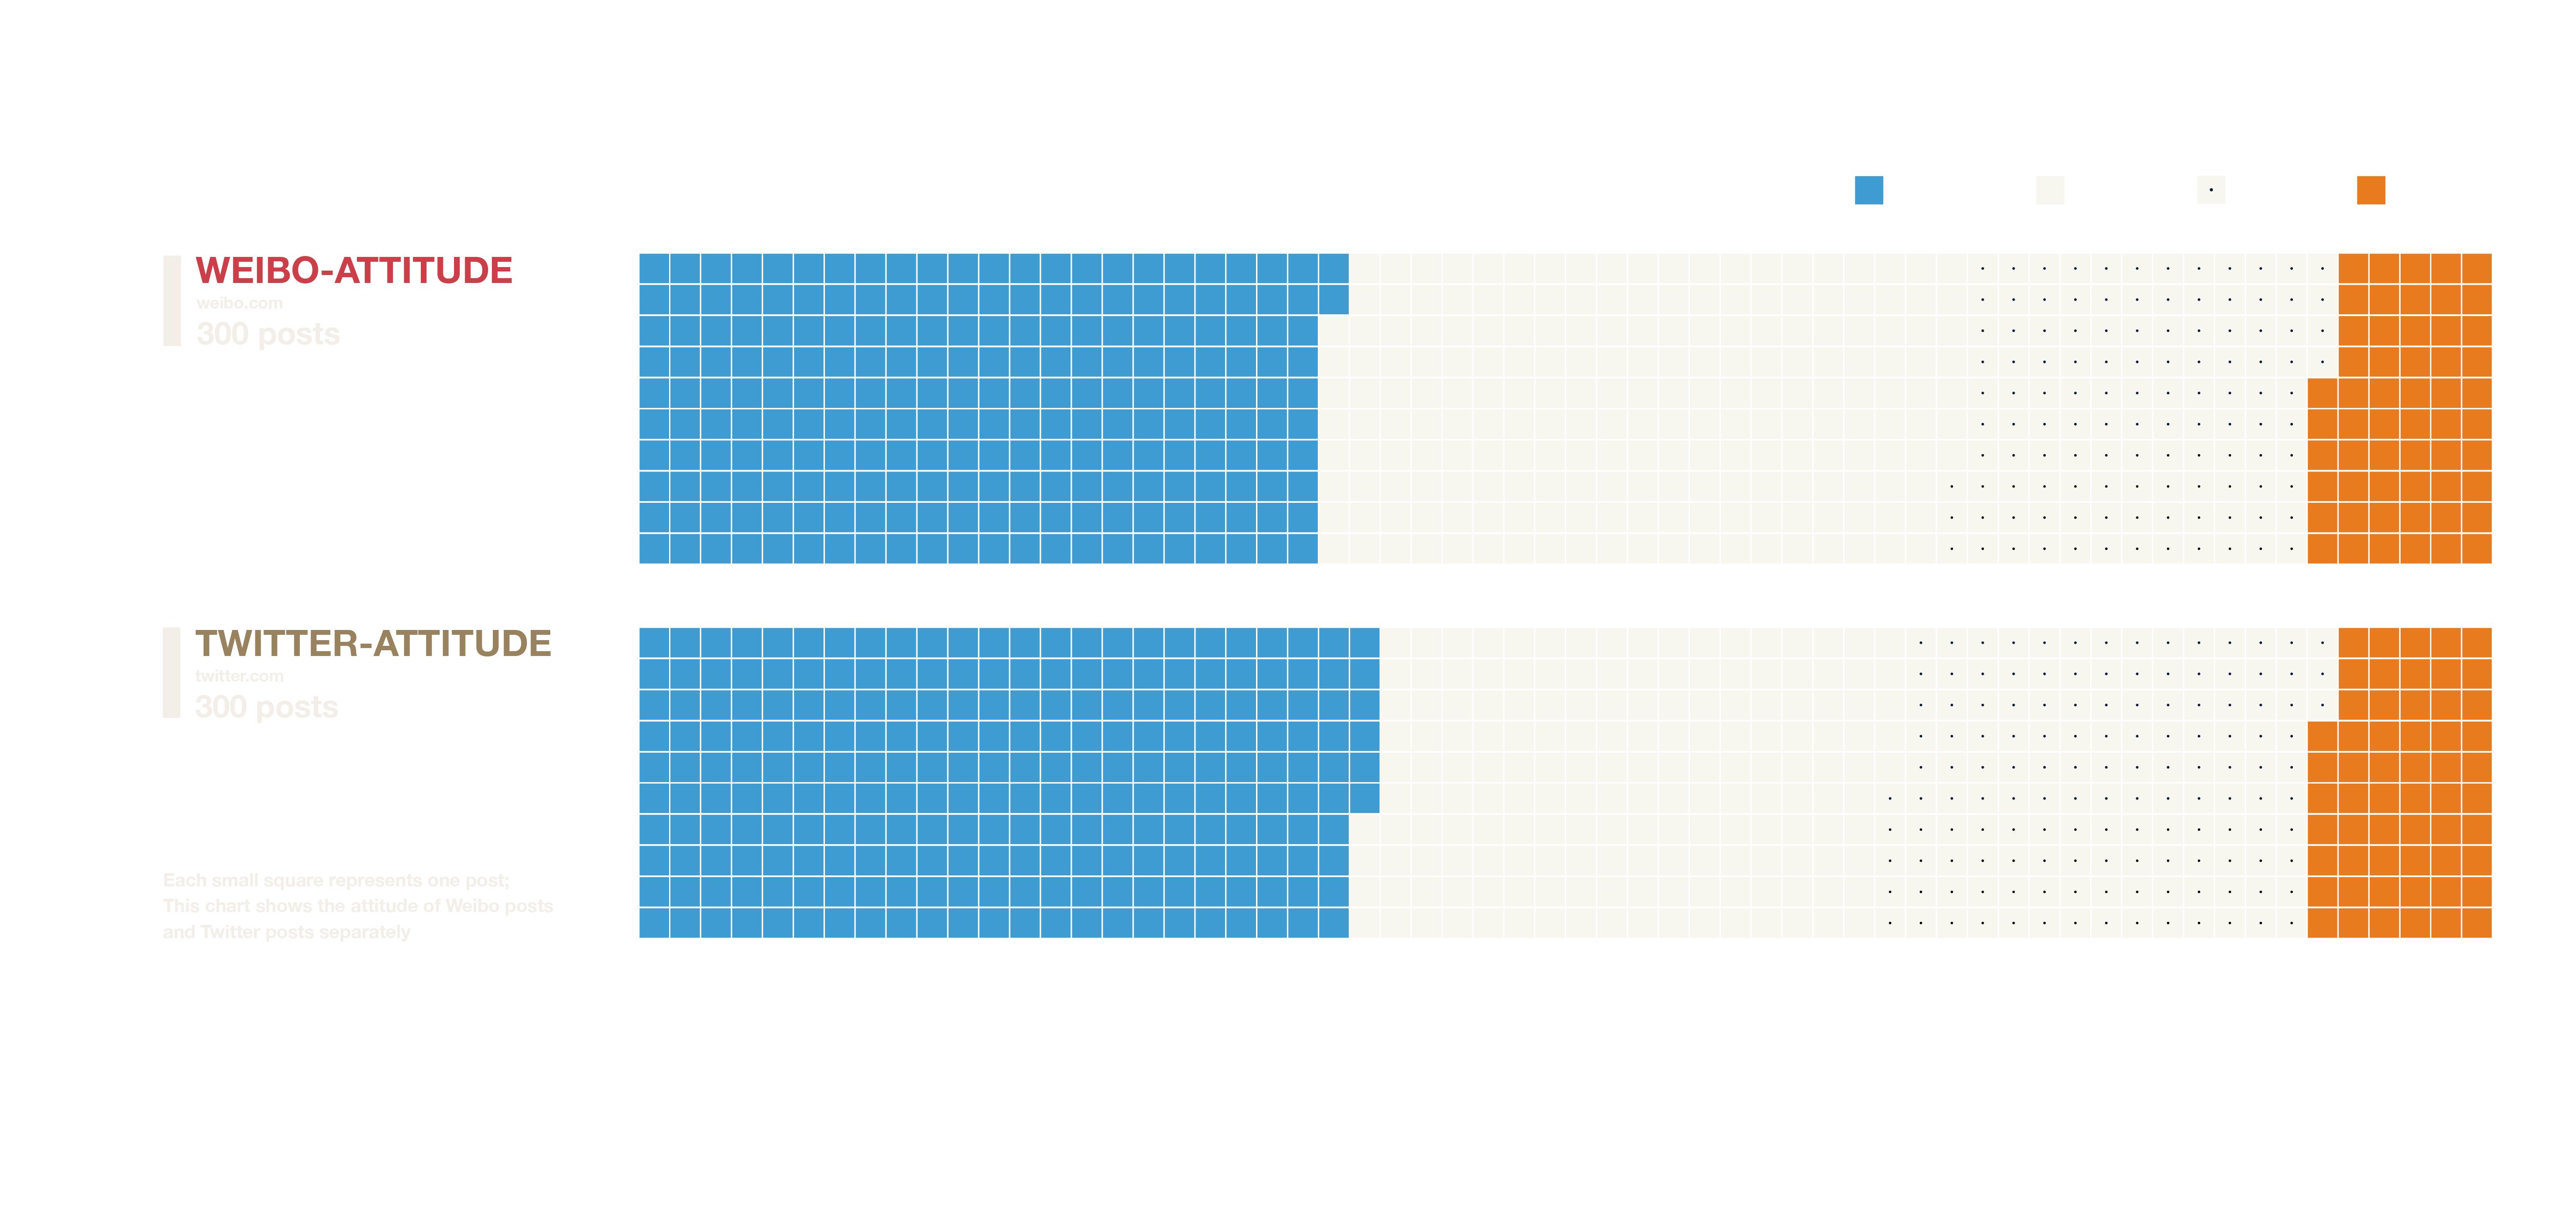
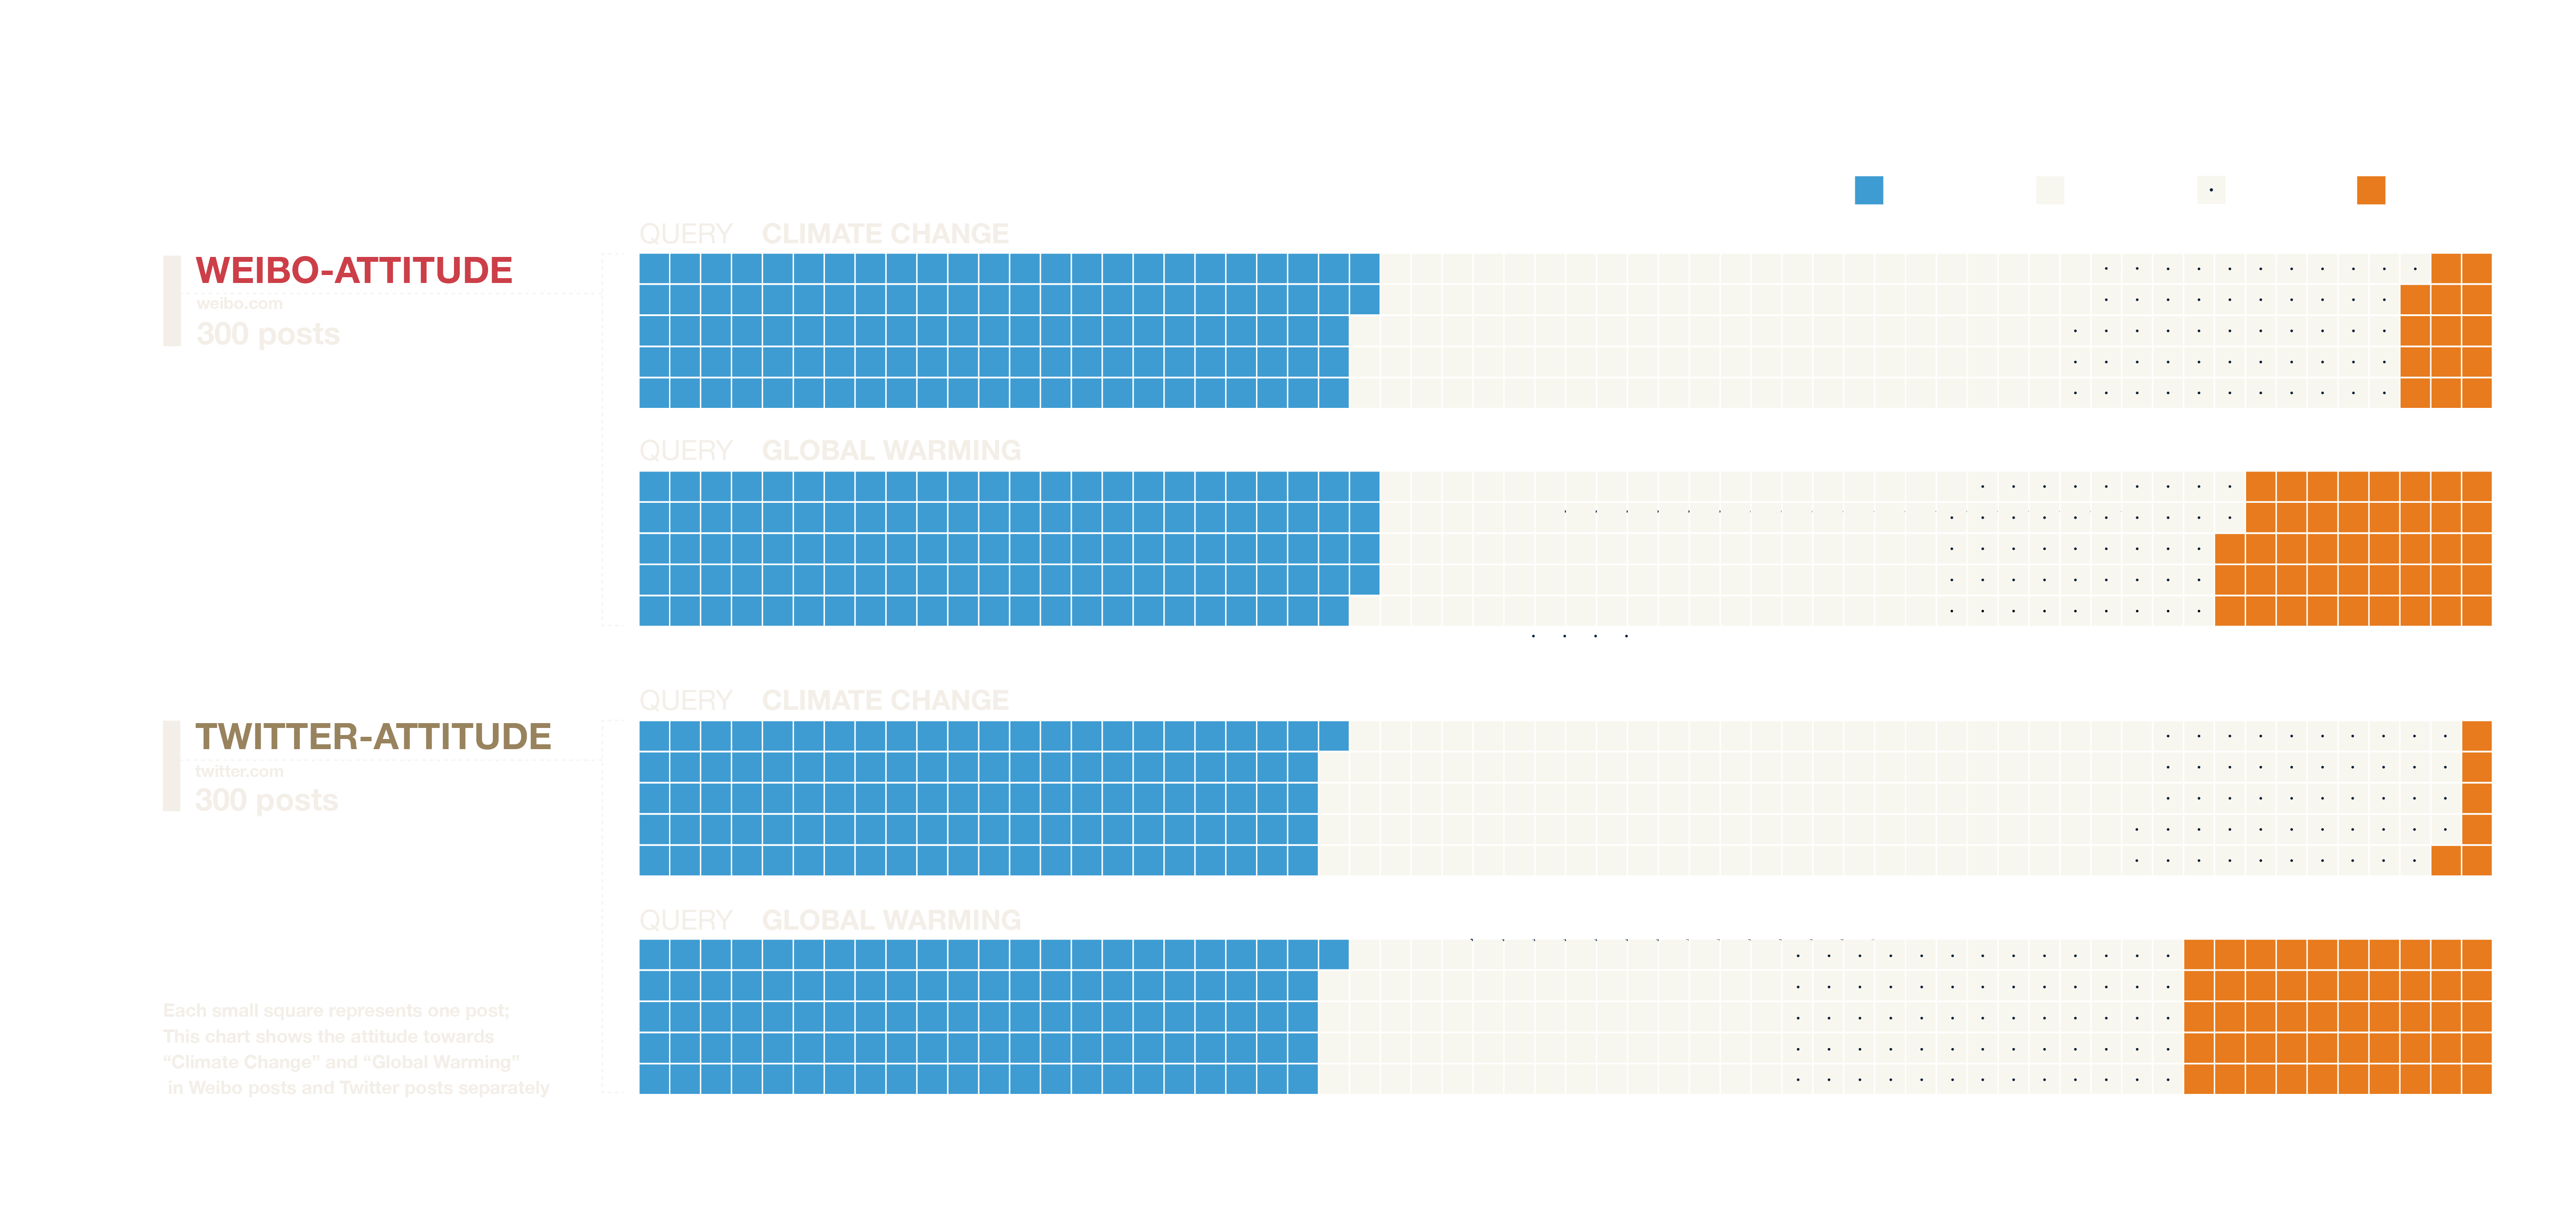
We classify each of the posts with an attitude and represent each of them with one small square forming a mosaic diagram. We use two colors with larger contrasts to identify supporting and opposition, while we used white square represent neutrality and then mark the debate in white with black circle in the center.
First of all, we can tell that there is more supporter than opponent about climate change and global warming, then we can see the people's attitude towards climate change and global warming roughly the same in twitter and weibo. At the end the opponents are almost from global warming.